 InfiniSynapse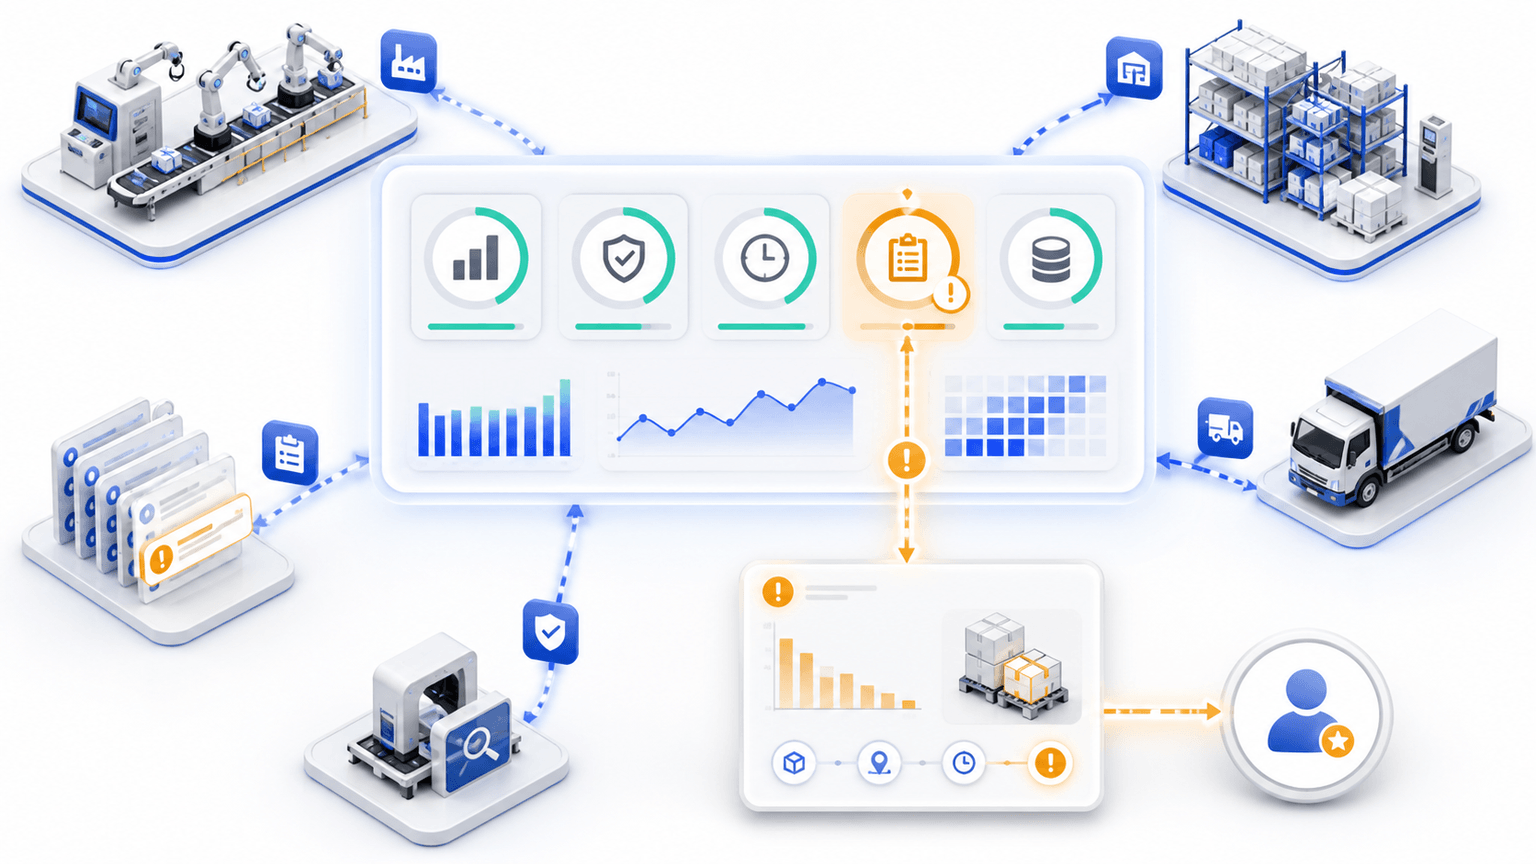
What is an operations dashboard?什么是运营仪表板?
An operations dashboard is a role-specific monitoring view that combines governed KPIs, targets, trends, data-quality signals, exceptions, drilldowns, and action ownership for recurring operational decisions.
运营仪表板是一种面向角色的监控视图,为重复运营决策整合受治理 KPI、目标、趋势、数据质量信号、异常、下钻与行动责任。
A useful dashboard answers five questions quickly: what needs attention, how material is it, compared with which target or baseline, what evidence explains it, and who owns the next review. It is not simply a wall of charts or a monthly presentation moved into software.
有效仪表板应快速回答五个问题:什么需要关注、影响有多大、相对哪个目标或基线、哪些证据能够解释,以及谁负责下一步复核。它不只是图表墙,也不是把月度演示文稿搬进软件。
The word “operations” spans manufacturing, warehouse, logistics, service delivery, procurement, inventory, field work, and business operations. A page for a plant supervisor should not copy the same KPIs, grain, latency, or layout as an executive operations view. Start from the decision and user, not an attractive template.
“运营”可以覆盖制造、仓储、物流、服务交付、采购、库存、现场工作与业务运营。工厂主管页面不应照搬高管运营视图的 KPI、粒度、延迟或布局。应从决策与用户开始,而不是从漂亮模板开始。
Operational, analytical, strategic, and scorecard views运营、分析、战略与评分卡视图
| View视图 | Purpose目的 | Typical horizon典型时间范围 | Primary output主要输出 |
|---|---|---|---|
| Operational dashboard运营仪表板 | Monitor current flow and material exceptions监控当前流程与重要异常 | Minutes to days分钟至天 | Status, queue, alert, owner, evidence状态、队列、预警、责任人、证据 |
| Analytical dashboard分析仪表板 | Investigate drivers, segments, patterns, and scenarios调查驱动因素、分组、模式与情景 | Weeks to years周至年 | Comparison, diagnosis, model, hypothesis比较、诊断、模型、假设 |
| Strategic dashboard战略仪表板 | Review progress against enterprise objectives复核企业目标进展 | Months to years月至年 | Outcome, trend, portfolio, strategic risk结果、趋势、组合、战略风险 |
| Scorecard评分卡 | Evaluate periodic performance under governed rules按受治理规则评估周期绩效 | Weekly to quarterly每周至每季度 | Target result, rating, review, action目标结果、评级、评审、行动 |
A mature operating system may link these views. The operational dashboard detects a missed target, the analytical view investigates drivers, and the scorecard records periodic accountability. Do not force every task into one overloaded page.
成熟运营体系可以连接这些视图:运营仪表板发现未达目标,分析视图调查驱动因素,评分卡记录周期问责。不要把所有任务强行塞进一个过载页面。
Define audience and decision before selecting KPIs选择 KPI 前先定义受众与决策
Write a one-page dashboard charter: audience, decisions, scope, cadence, response window, materiality, authorized actions, escalation, sources, display context, and success criteria. A shift lead may need line, station, hour, current queue, and named exception ownership. A COO may need network, week, service, cost, capacity, risk, and cross-functional action.
建立一页仪表板章程:受众、决策、范围、频率、响应窗口、重要性、授权行动、升级、来源、展示环境与成功标准。班组长可能需要产线、工位、小时、当前队列与明确异常责任;COO 可能需要网络、周、服务、成本、产能、风险与跨职能行动。
One screen does not mean one universal dashboard. Use a focused opening view for each role, then provide governed drill paths. Different roles can share metric contracts without sharing the same layout.
单屏不等于一个通用仪表板。为每个角色提供聚焦的首屏,再设置受治理下钻路径。不同角色可以共享指标口径,但不必共享相同布局。
Fix object grain, time boundary, and eligibility固定对象粒度、时间边界与资格
State whether a row or event represents a unit, batch, order line, job, shipment, case, work item, machine state, location, shift, or day. Mixing grains creates duplicated totals and misleading rates. Publish event time, posting time, timezone, calendar, shift boundary, late-arriving data, corrections, restatements, and whether open work is included.
说明一行或事件代表单位、批次、订单行、任务、运输、案例、工作项、设备状态、位置、班次还是日期。混合粒度会产生重复合计和误导比率。公布事件时间、过账时间、时区、日历、班次边界、迟到数据、更正、重述以及是否包含未完成工作。
Eligibility rules matter as much as formulas: planned versus unplanned work, canceled orders, rework, test runs, buyer-caused delay, supplier-caused delay, force majeure, partial completion, zero denominators, missing confirmations, and disputed events. Show exclusions rather than silently improving the result.
资格规则与公式同样重要:计划与非计划工作、取消订单、返工、试运行、买方原因延迟、供应商原因延迟、不可抗力、部分完成、零分母、缺失确认与争议事件。应显示排除项,而不是静默改善结果。
Create a contract for every operations KPI为每个运营 KPI 建立口径合同
Record KPI purpose, owner, audience, formula, numerator, denominator, unit, grain, eligible population, source, timestamp, target, threshold, direction, tolerance, aggregation, missing policy, minimum sample, version, effective date, refresh service level, and evidence drill path. Keep the actual value, target, status, trend, data age, and coverage visible together.
记录 KPI 目的、责任人、受众、公式、分子、分母、单位、粒度、合格总体、来源、时间戳、目标、阈值、方向、容差、聚合、缺失政策、最低样本、版本、生效日期、刷新服务水平与证据下钻路径。把实际值、目标、状态、趋势、数据年龄与覆盖一起显示。
Do not average averages. Recompute a rate from comparable underlying numerators and denominators. A 100% result from two jobs does not carry the same evidence as 98% from 20,000 jobs.
不要直接平均各组比率。应汇总口径一致的底层分子和分母,再重新计算总体比率。两个任务得到的100%,与两万个任务得到的98%,所代表的样本规模和证据强度并不相同。
Operations dashboard KPIs and formulas运营仪表板 KPI 与公式
| KPIKPI | Illustrative formula示例公式 | Control question控制问题 |
|---|---|---|
| Output attainment产出达成率 | Actual eligible output ÷ planned eligible output × 100实际合格产出 ÷ 计划合格产出 × 100 | Is the plan frozen, feasible, and unit-consistent?计划是否冻结、可行且单位一致? |
| Throughput吞吐量 | Good completed units ÷ operating time良品完成数量 ÷ 运行时间 | Which states count as operating time?哪些状态计入运行时间? |
| First-pass yield一次合格率 | Units passing without rework ÷ units entering process × 100无需返工即通过单位 ÷ 进入流程单位 × 100 | Are scrap, repair, and repeated tests identified?是否识别报废、修理与重复测试? |
| On-time completion准时完成率 | Eligible jobs completed by promise ÷ eligible completed jobs × 100承诺前完成的合格任务 ÷ 合格已完成任务 × 100 | Which promise version, timezone, and tolerance apply?使用哪个承诺版本、时区与容差? |
| Cycle time周期时间 | Completion timestamp − eligible start timestamp完成时间戳 − 合格开始时间戳 | Are wait, hold, queue, and rework included?是否包括等待、暂停、排队与返工? |
| Overdue backlog rate逾期积压率 | Open items past due ÷ open eligible items × 100已逾期未完成项 ÷ 未完成合格项 × 100 | Can due dates be overwritten without history?到期日能否在无历史情况下被覆盖? |
| Capacity utilization产能利用率 | Actual output ÷ defined practical capacity × 100实际产出 ÷ 已定义实践产能 × 100 | Is capacity theoretical, demonstrated, or scheduled?产能是理论、已验证还是计划产能? |
| Data freshness数据新鲜度 | Dashboard evaluation time − latest eligible source time仪表板评估时间 − 最新合格源时间 | Is source time different from ingestion time?源时间与摄取时间是否不同? |
For equipment-specific efficiency, use the governed OEE calculation rather than inventing a simplified dashboard variant. For fulfillment, define OTIF and on-time delivery separately.
Operations dashboard KPI calculator运营仪表板 KPI 计算器
Use this educational example to calculate four opening-screen indicators and a freshness gate. A breach count helps reviewers prioritize investigation; it is not a composite performance rating.
使用此教学示例计算四个首屏指标与一个新鲜度门槛。未达标数量帮助复核人确定调查优先级,但不是综合绩效评级。
Worked operations dashboard example运营仪表板计算示例
Hypothetical example: a daily production and fulfillment view shows 920 actual units against 1,000 planned, 950 first-pass good units from 1,000 starts, 88 on-time jobs from 100 completed, 12 overdue items from 80 open, and data updated 20 minutes ago against a 30-minute freshness requirement.
假设示例:某每日生产与履约视图显示:实际产出920、计划产出1,000;1,000个进入流程单位中有950个一次通过良品;100个已完成任务中88个准时;80个未完成项中12个逾期;数据在20分钟前更新,而新鲜度要求为30分钟。
On-time completion is 88%, overdue backlog is 15%, and freshness passes. Four performance thresholds fail, so the opening screen should prioritize the material gap and offer drilldown by line, shift, product, reason, customer promise, and owner. The display should not conclude that one factor caused every miss.
准时完成率为88%,逾期积压率为15%,新鲜度通过。四项绩效阈值未达标,因此首屏应优先显示重要差距,并支持按产线、班次、产品、原因、客户承诺与责任人下钻。界面不能断言某一个因素导致全部未达标。
Design a one-screen operations dashboard layout设计单屏运营仪表板布局
- Context bar.情境栏。 Show scope, period, timezone, last refresh, coverage, formula version, and active filters.显示范围、期间、时区、最后刷新、覆盖、公式版本与活动筛选。
- Decision KPI strip.决策 KPI 条。 Place a small set of actuals with target, variance, status, and trend—not isolated numbers.放置少量实际值,并同时显示目标、差异、状态与趋势,而不是孤立数字。
- Flow and trend.流程与趋势。 Show where work is accumulating or performance changed over a meaningful comparison period.显示工作积聚位置或绩效在有意义比较期间内的变化。
- Exception queue.异常队列。 Rank material exceptions by business impact, urgency, confidence, and response status.按业务影响、紧迫性、置信度与响应状态排列重要异常。
- Evidence drilldown.证据下钻。 Link summary results to comparable entities, event timelines, reason codes, and source records.把汇总结果连接到可比实体、事件时间线、原因代码与源记录。
- Action panel.行动面板。 Show owner, due time, approval, comment, escalation, and outcome without pretending the dashboard executes work.显示责任人、到期时间、审批、评论、升级与结果,但不假装仪表板执行工作。
Match each visual to an operational question让每种图表匹配一个运营问题
| Question问题 | Useful visual适用图表 | Avoid避免 |
|---|---|---|
| Are we on target?是否达标? | KPI card with target, variance, trend, and status label带目标、差异、趋势和状态标签的 KPI 卡 | A large number without context缺少情境的大数字 |
| Where is work accumulating?工作在哪里积聚? | Ordered bars, queue age bands, or process flow排序条形、队列年龄区间或流程图 | Pie charts with many categories类别过多的饼图 |
| When did performance change?绩效何时变化? | Time series with target and annotation带目标与注释的时间序列 | Truncated axes that exaggerate change夸大变化的截断坐标轴 |
| Which entity drives the gap?哪个实体驱动差距? | Sorted contribution bars or small multiples排序贡献条形或小多图 | Unranked tables with hundreds of rows数百行未排序表格 |
| Is the process stable?流程是否稳定? | Appropriate control or distribution view with defined limits带定义界限的适当控制图或分布图 | Arbitrary red/yellow/green bands任意红黄绿区间 |
Use governed targets, thresholds, and alert rules使用受治理的目标、阈值与预警规则
A target describes desired performance. A control limit describes expected process variation under a method. An alert rule decides when a review should occur. They are not interchangeable. Define direction, boundary inclusivity, tolerance, persistence, hysteresis, materiality, confidence, suppression, escalation, and reset.
目标描述期望绩效;控制界限描述某方法下的预期流程波动;预警规则决定何时应复核。三者不能互换。定义方向、边界包含、容差、持续性、滞后、重要性、置信、抑制、升级与重置。
Color must not be the only status signal. Use labels and icons, and show why a threshold fired. Avoid flashing on one late record if the decision requires three consecutive intervals, and avoid suppressing a serious safety, quality, compliance, or customer-impact gate because the overall average looks healthy.
颜色不能成为唯一状态信号。使用标签与图标,并说明阈值为何触发。如果决策要求连续三个期间,就不要因一条迟到记录闪烁;也不能因为总体平均良好而压制严重安全、质量、合规或客户影响门槛。
Connect summary KPIs to evidence and response把汇总 KPI 连接到证据与响应
A drill path should move from portfolio to region, site, process, line, shift, product, customer, supplier, job, or event only where that hierarchy is valid. Preserve filters and denominators. Show top contributors, not only lowest percentages; a small entity with 0% may be less material than a large entity missing target by two points.
下钻路径应在层级有效时,从组合移动到区域、站点、流程、产线、班次、产品、客户、供应商、任务或事件。保留筛选和分母。显示主要贡献者,而不只显示最低百分比;一个0%的小实体可能没有一个低于目标2个百分点的大实体重要。
The response loop needs an owner, review deadline, evidence, decision, approval, action, escalation, status, and measured outcome. If those fields live in another workflow system, link to that record and clearly separate monitoring from execution.
响应闭环需要责任人、复核截止时间、证据、决策、审批、行动、升级、状态与已衡量结果。如果这些字段位于其他工作流系统,应链接到该记录并明确区分监控与执行。
Display data freshness, coverage, and quality显示数据新鲜度、覆盖与质量
Latest eligible event time, ingestion time, expected latency, and stale status.
最新合格事件时间、摄取时间、预期延迟与陈旧状态。
Eligible entities and periods represented versus expected population.
已表示的合格实体与期间相对于预期总体。
Records passing type, range, reference, sequence, and business-rule checks.
通过类型、范围、参考、顺序与业务规则检查的记录。
Dashboard totals matched to approved source totals and correction history.
仪表板合计与获批源合计及更正历史匹配。
When evidence is stale or incomplete, label the result “data incomplete” rather than “good.” A green metric calculated from half the expected sites is not a trustworthy enterprise status.
当证据陈旧或不完整时,应标记“数据不完整”,而不是“良好”。仅从一半预期站点计算的绿色指标不是可信企业状态。
How to build an operations dashboard如何建立运营仪表板
- Select one role and decision cycle.选择一个角色与决策周期。 Document questions, response windows, authorized actions, and success measures.记录问题、响应窗口、授权行动与成功指标。
- Inventory sources and evidence.盘点来源与证据。 Map systems, owners, keys, grain, history, latency, corrections, and access.映射系统、责任人、键、粒度、历史、延迟、更正与访问。
- Publish KPI contracts.公布 KPI 口径。 Reconcile formulas with responsible operations, finance, quality, and data owners.与负责运营、财务、质量和数据的人员核对公式。
- Sketch the response path.绘制响应路径。 Connect each opening KPI to a valid diagnostic view, source evidence, and owner.把每个首屏 KPI 连接到有效诊断视图、源证据与责任人。
- Build a thin vertical slice.构建精简纵向切片。 Use one process and complete the source-to-action path before adding more metrics.使用一个流程,先完成从来源到行动的路径,再增加指标。
- Replay historical periods.重放历史期间。 Test normal, threshold, missing, late, corrected, disputed, and high-impact cases.测试正常、阈值、缺失、迟到、更正、争议与高影响案例。
- Run the management cadence.运行管理节奏。 Measure whether users notice, investigate, decide, act, and close within the intended window.衡量用户能否在目标窗口内发现、调查、决策、行动与关闭。
Embed the dashboard in daily operations management把仪表板嵌入日常运营管理
A dashboard without a review routine becomes passive reporting. Define who reviews at shift start, daily, weekly, and monthly; which exceptions can be solved locally; which must escalate; how actions are recorded; and how unresolved items transfer between shifts or teams.
没有评审例程的仪表板会变成被动报告。定义谁在班次开始、每日、每周和每月复核;哪些异常可本地解决;哪些必须升级;如何记录行动;以及未解决事项如何在班次或团队间交接。
| Cadence频率 | Focus重点 | Output输出 |
|---|---|---|
| Shift or hourly班次或小时 | Safety, flow, current constraint, quality, urgent backlog安全、流程、当前约束、质量、紧急积压 | Immediate owner and containment即时责任人与遏制 |
| Daily每日 | Plan attainment, service, recurring loss, overdue action计划达成、服务、重复损失、逾期行动 | Priority, escalation, due date优先级、升级、到期日 |
| Weekly每周 | Trend, systemic drivers, capacity, supplier, cost, action effectiveness趋势、系统驱动、产能、供应商、成本、行动有效性 | Cross-functional improvement plan跨职能改善计划 |
| Monthly每月 | Outcome, target suitability, portfolio tradeoff, investment结果、目标适用性、组合权衡、投资 | Policy, target, resource, or design decision政策、目标、资源或设计决策 |
Evaluate operations dashboard software评估运营仪表板软件
Choose the technology from the operating need. A governed spreadsheet may suit a small stable process. BI can provide reusable models and analysis. MES, WMS, TMS, workflow, or operations platforms may supply live status and execution context. An analysis layer can connect authorized evidence across systems without becoming the transaction system.
应根据运营需求选择技术。受治理电子表格可适合小型稳定流程;BI 可以提供可复用模型与分析;MES、WMS、TMS、工作流或运营平台可以提供实时状态与执行情境;分析层可以跨系统连接获准证据,而不成为交易系统。
Evaluate connectors, APIs, streaming and batch support, object hierarchy, semantic model, formula versioning, target history, late events, corrections, row security, refresh monitoring, cache behavior, alerts, subscriptions, drill-through, comments, action links, audit, mobile and wall-display modes, accessibility, exports, performance, administration, recovery, licensing, implementation, and exit cost.
评估连接器、API、流式与批量支持、对象层级、语义模型、公式版本、目标历史、迟到事件、更正、行级安全、刷新监控、缓存行为、预警、订阅、下钻、评论、行动链接、审计、移动与大屏模式、无障碍、导出、性能、管理、恢复、许可、实施与退出成本。
Verify native versus custom. Ask who will maintain connectors, models, thresholds, security, alerts, and dashboards after launch. A low license price can hide substantial data and administration work.
核实原生与定制能力。询问上线后由谁维护连接器、模型、阈值、安全、预警与仪表板。较低许可价格可能掩盖大量数据与管理工作。
Validate the operations dashboard with frozen scenarios用冻结情景验证运营仪表板
Before a proof of concept, freeze representative extracts, formula versions, targets, thresholds, expected results, and response cases. Include normal periods, exact boundaries, zero denominators, missing sources, stale feeds, late events, corrections, duplicate identities, high volume, mobile users, wall displays, and restricted rows.
POC 前冻结代表性提取、公式版本、目标、阈值、预期结果与响应案例。包括正常期间、精确边界、零分母、缺失来源、陈旧数据流、迟到事件、更正、重复身份、高数据量、移动用户、大屏与受限行。
- Reconciliation: reproduce numerators, denominators, rates, targets, status, and totals.核对:复现分子、分母、比率、目标、状态与合计。
- Detection: confirm material cases surface without unacceptable noise or missed events.检测:确认重要案例能够出现,同时不存在不可接受噪声或漏报。
- Response: observe whether users can identify evidence, owner, action, and escalation in time.响应:观察用户能否及时识别证据、责任人、行动与升级。
- Operation: measure refresh reliability, query speed, administration, permissions, and total effort.运营:衡量刷新可靠性、查询速度、管理、权限与总工作量。
Common operations dashboard mistakes运营仪表板常见错误
- Building one dashboard for every role, process, cadence, and decision.为所有角色、流程、频率与决策建立同一个仪表板。
- Choosing KPIs from a template without a decision charter or metric contract.在没有决策章程或指标口径时从模板选择 KPI。
- Showing current values without target, variance, trend, freshness, or coverage.显示当前值,却没有目标、差异、趋势、新鲜度或覆盖。
- Mixing grains, units, calendars, promise versions, and denominators.混合粒度、单位、日历、承诺版本与分母。
- Using color alone or arbitrary thresholds to communicate urgency.仅使用颜色或任意阈值表达紧迫性。
- Providing no evidence drilldown, owner, or action path.没有证据下钻、责任人或行动路径。
- Treating stale or incomplete data as a healthy green result.把陈旧或不完整数据视为健康绿色结果。
- Measuring dashboard views instead of decision time, action closure, and outcomes.只衡量仪表板浏览,而不是决策时间、行动关闭与结果。
Where InfiniSynapse can support operations dashboard analysisInfiniSynapse 可以支持哪些运营仪表板分析
InfiniSynapse can be considered as an analysis layer for exploring authorized order, job, item, asset, site, shift, inventory, production, quality, supplier, shipment, service, cost, metric, exception, document, and action evidence. Analysts can connect relevant sources, calculate governed views, compare entities and periods, investigate anomalies, reconcile results, and prepare traceable operational summaries.
InfiniSynapse 可作为分析层,探索获准使用的订单、任务、物料、资产、站点、班次、库存、生产、质量、供应商、运输、服务、成本、指标、异常、文件与行动证据。分析人员可连接相关来源、计算受治理视图、比较实体与期间、调查异常、核对结果并准备可追溯运营摘要。
Boundary: InfiniSynapse is not presented here as an ERP, MES, WMS, TMS, SCADA, production-control system, workflow engine, alert dispatch service, system of record, autonomous decision engine, or transaction/writeback tool.
边界:本文不把 InfiniSynapse 描述为 ERP、MES、WMS、TMS、SCADA、生产控制系统、工作流引擎、预警派发服务、记录系统、自动决策引擎或交易/回写工具。
Explore a governed operations question探索一个受治理的运营问题
Prepare the dashboard charter, object hierarchy, representative extracts, KPI contracts, targets, thresholds, known exceptions, expected drill paths, permissions, actions, and historical outcomes. Use the InfiniSynapse analytical workspace to explore connected evidence.
准备仪表板章程、对象层级、代表性提取、KPI 口径、目标、阈值、已知异常、预期下钻路径、权限、行动与历史结果。使用 InfiniSynapse 分析工作区探索关联证据。
Try the analytical workspace试用分析工作区Operations dashboard FAQ运营仪表板常见问题
It is a role-specific monitoring view that combines governed KPIs, targets, trends, data-quality signals, exceptions, drilldowns, and action ownership.
它是一种面向角色的监控视图,整合受治理 KPI、目标、趋势、数据质量信号、异常、下钻与行动责任。
Depending on the decision: output attainment, throughput, first-pass yield, on-time completion, cycle time, backlog age, capacity, downtime, cost, safety, and freshness.
视决策而定,包括产出达成率、吞吐量、一次合格率、准时完成率、周期时间、积压年龄、产能、停机、成本、安全与新鲜度。
Only enough for the audience to detect status, understand material deviation, and decide what to investigate; put supporting detail in drilldowns.
只保留足够让受众发现状态、理解重要偏差并决定调查内容的 KPI;支持细节放入下钻。
No. Refresh frequency should match the decision window and response capacity; it may be minutes, hourly, daily, or longer.
不需要。刷新频率应匹配决策窗口与响应能力,可以是分钟、小时、每日或更长。
A dashboard emphasizes current status, trends, and exceptions; a scorecard emphasizes periodic performance against governed targets and review outcomes.
仪表板强调当前状态、趋势与异常;评分卡强调相对于受治理目标的周期绩效与评审结果。
Test integration, metric governance, freshness, drilldown, alerts, security, audit, usability, administration, performance, total cost, and decision outcomes.
测试集成、指标治理、新鲜度、下钻、预警、安全、审计、易用性、管理、性能、总成本与决策结果。
No. It is positioned here as an analysis layer, not an ERP, MES, WMS, TMS, workflow, production-control, or transaction writeback system.
不可以。这里将其定位为分析层,而不是 ERP、MES、WMS、TMS、工作流、生产控制或交易回写系统。
Sources and limitations来源与局限
Primary references: Microsoft Learn dashboard design guidance, which recommends designing for the audience, monitoring key information on one screen, and using underlying reports for detail; Microsoft Learn KPI visualization guidance, which defines a KPI visual around a base measure, target, and threshold; and the NIST publication on KPI hierarchy for production-system improvement, which discusses throughput, availability, quality, efficiency, and relationships among operational KPIs. Sources reviewed August 18, 2026.
主要参考:Microsoft Learn 仪表板设计指南,建议为受众设计、在单屏监控关键信息,并通过底层报告提供细节;Microsoft Learn KPI 可视化指南,以基础度量、目标和阈值定义 KPI 视图;以及 NIST 关于生产系统改善 KPI 层级的出版物,讨论吞吐量、可用性、质量、效率及运营 KPI 之间的关系。来源核验于2026年8月18日。
The formulas, targets, example, breach count, layout, review cadence, and software criteria are educational starting points, not a universal dashboard, certification, control limit, production instruction, staffing decision, financial conclusion, safety determination, or autonomous action. Validate them with responsible operations, quality, engineering, planning, finance, safety, risk, compliance, legal, security, data, and system owners.
本文公式、目标、示例、未达标数量、布局、评审节奏与软件标准是教学起点,不是通用仪表板、认证、控制界限、生产指令、人员配置决定、财务结论、安全判定或自动行动。应由负责运营、质量、工程、计划、财务、安全、风险、合规、法务、安全、数据与系统的人员验证。