 InfiniSynapse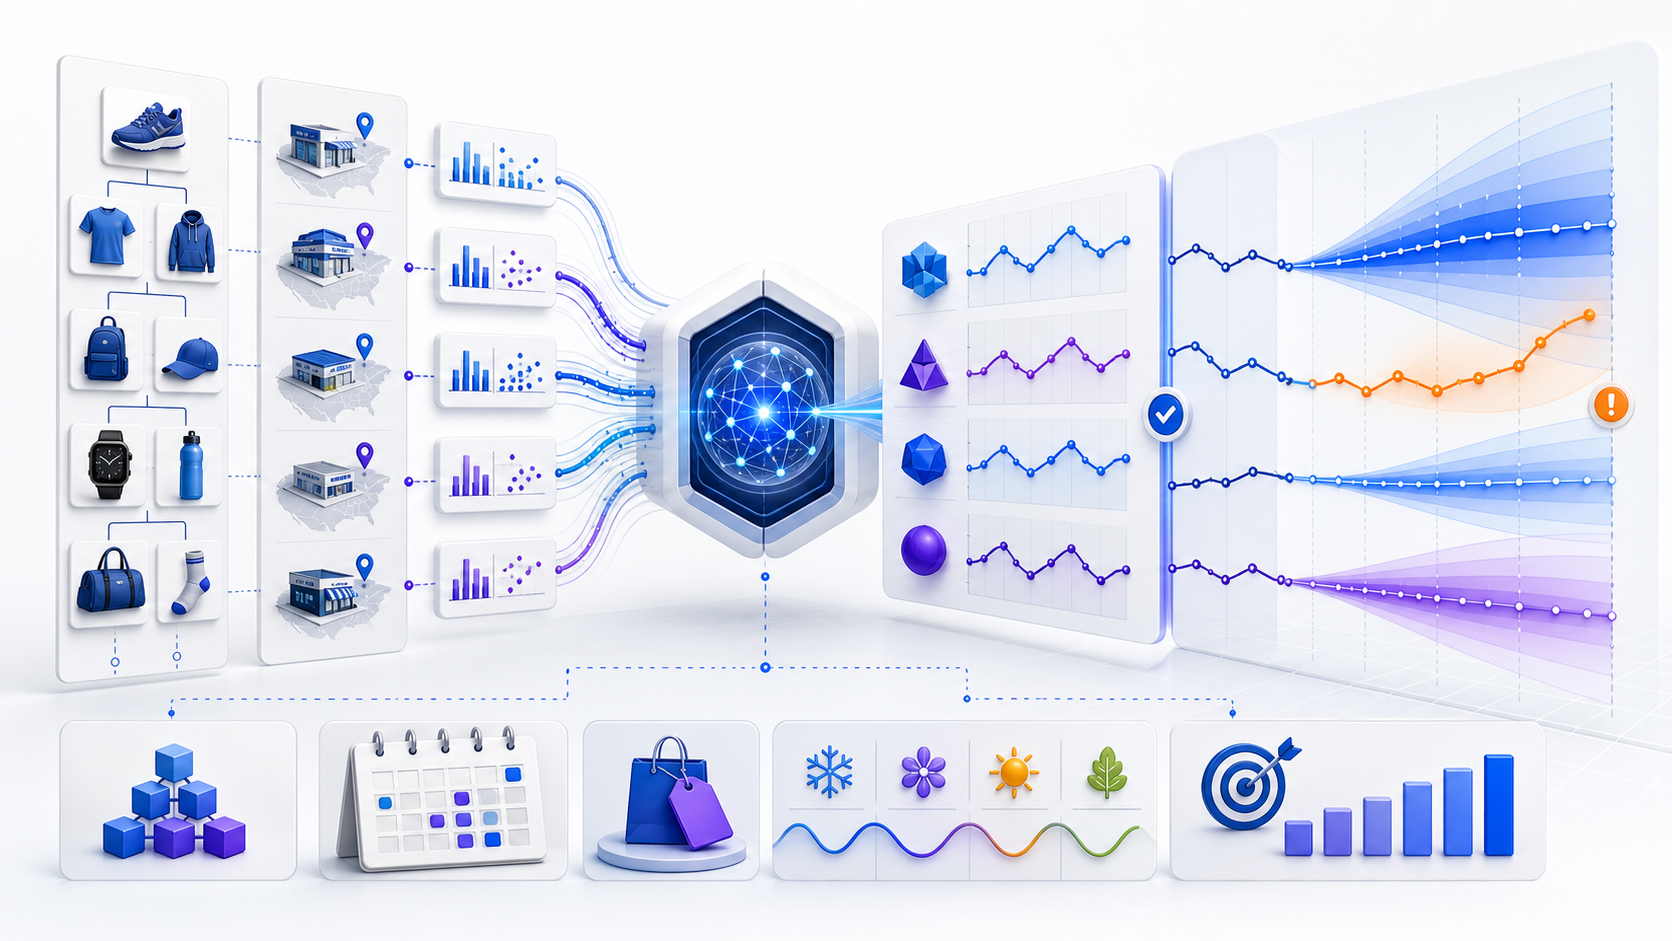
What is demand forecasting software?什么是需求预测软件?
Demand forecasting software prepares historical demand and related signals, fits and compares forecasting models, and produces time-phased estimates of future demand at defined product, location, customer, channel, and time levels.
需求预测软件处理历史需求及相关信号,拟合并比较预测模型,再按定义好的产品、地点、客户、渠道和时间层级生成未来需求的时间序列估计。
Outputs may be point forecasts, quantiles, prediction intervals, model diagnostics, exceptions, and explanations. Good software also preserves the forecast version that existed at each decision cutoff so users can compare like with like after actual demand arrives.
输出可以包括点预测、分位数、预测区间、模型诊断、异常与解释。好的软件还会保留每个决策截点当时存在的预测版本,使实际需求到来后能够按相同口径比较。
A forecast is an uncertain input to a decision, not an automatic order. Purchasing, replenishment, inventory policy, production, pricing, and finance need additional constraints and objectives. Software should make this boundary visible instead of presenting one number as certainty.
预测是决策中的不确定输入,不是自动订单。采购、补货、库存政策、生产、定价与财务还需要其他约束和目标。软件应清楚呈现这一边界,而不是把一个数字包装成确定事实。
Demand forecasting vs demand planning and inventory forecasting需求预测、需求计划与库存预测的区别
| Capability能力 | Core question核心问题 | Primary output主要输出 |
|---|---|---|
| Demand forecasting需求预测 | What demand is likely over the horizon?预测周期内可能出现多少需求? | Point or probabilistic forecast and diagnostics点预测或概率预测及诊断 |
| Demand planning需求计划 | What demand plan will the organization use?组织将采用哪版需求计划? | Reviewed, reconciled, approved plan经复核、协调与批准的计划 |
| Inventory forecasting库存预测 | How will stock change after demand and supply?需求与供应作用后库存如何变化? | Projected stock, shortage, excess, net requirement预计库存、短缺、过剩与净需求 |
| Replenishment or supply planning补货或供应计划 | What feasible action should be taken?应采取什么可行行动? | Orders, transfers, production or recommendations订单、调拨、生产或建议 |
Many suites combine these layers, but buyers should verify what is native, integrated, configured, or custom. The companion demand planning software guide focuses on workflow and consensus; the inventory forecasting guide focuses on stock-flow projection.
许多套件会组合这些层次,但买方应核实哪些能力是原生、集成、配置或定制。配套的需求计划软件指南聚焦工作流与共识;库存预测指南聚焦库存流量推演。
Define the forecasting decision before the tool先定义预测决策,再选择工具
Document the business decision, user, forecast object, grain, hierarchy, horizon, lead time, update frequency, decision cutoff, required quantiles, special events, acceptable latency, downstream consumer, and economic error asymmetry. A weekly SKU-location replenishment input and a quarterly category budget need different designs.
记录业务决策、用户、预测对象、粒度、层级、周期、提前期、更新频率、决策截点、所需分位数、特殊事件、允许延迟、下游消费者与错误成本的不对称性。每周 SKU-地点补货输入与季度品类预算需要不同设计。
Separate must-have requirements from differentiators. A requirement should be testable: “generate P50 and P90 forecasts for 50,000 active SKU-location series within the nightly window and retain model/version lineage” is stronger than “use advanced AI at scale.”
把强制要求与差异化要求分开。需求必须可测试:“在夜间窗口内为 50,000 条活跃 SKU-地点序列生成 P50 与 P90 预测,并保留模型和版本血缘”,比“规模化使用先进 AI”更有验收价值。
Prepare demand data that matches reality准备符合业务现实的需求数据
Candidate software should ingest historical orders or consumption, calendar, product and location hierarchies, lifecycle, price, promotions, stock availability, lost-sales indicators, returns, cancellations, channels, customers, weather or economic signals when justified, and the forecast versions used by operations.
候选软件应能按场景接入历史订单或消耗、日历、产品与地点层级、生命周期、价格、促销、库存可用性、损失销售指标、退货、取消、渠道、客户,以及有依据的天气或经济信号,并保留运营实际使用过的预测版本。
Define what “demand” means. Orders can include cancellations and constrained quantities; shipments can hide stockouts; point-of-sale may omit upstream demand; revenue mixes price and volume. Mark closed periods, normalize units, preserve event time, and prevent future information from leaking into model training.
必须定义“需求”的含义。订单可能含取消与受限数量;发货会掩盖缺货;POS 可能忽略上游需求;收入则混合价格与数量。应标记已关闭期间、统一单位、保留事件时间,并防止未来信息泄漏到模型训练中。
Data quality is part of the product test. Include zeros, missing periods, outliers, intermittent series, stockouts, new items, discontinued items, promotion spikes, hierarchy changes, and late corrections. Do not let a vendor silently remove hard series from the accuracy report.
数据质量本身就是产品测试的一部分。应包含零值、缺失期间、异常、间歇序列、缺货、新品、停产品、促销峰值、层级变化与迟到修正。不要允许候选方从准确率报告中静默删除困难序列。
Evaluate methods by demand pattern根据需求形态评估方法
Naive, seasonal naive, moving averages, and exponential smoothing provide transparent benchmarks and strong results for many stable series.
朴素、季节朴素、移动平均与指数平滑提供透明基线,对许多稳定序列也可能表现良好。
ETS, ARIMA-family, Prophet-style, and state-space methods represent trend, seasonality, autocorrelation, and structural components differently.
ETS、ARIMA 族、Prophet 类与状态空间方法以不同方式表达趋势、季节性、自相关和结构成分。
Regression, boosted trees, neural networks, and ensembles can use price, promotion, calendar, weather, and other explanatory features—but require leakage and drift controls.
回归、提升树、神经网络与集成可以使用价格、促销、日历、天气等解释特征,但必须控制泄漏与漂移。
Sparse-demand methods and quantile or distribution forecasts better support service and risk decisions than forcing every series into a smooth point forecast.
稀疏需求方法以及分位数或分布预测,比强迫所有序列使用平滑点预测更能支持服务与风险决策。
Automatic best-fit selection can be valuable when it chooses models per series using out-of-sample criteria and retains a baseline challenger. Ask which algorithms are eligible, how hyperparameters are set, how failures fall back, and whether users can reproduce the selection.
如果自动最佳拟合能按序列使用样本外标准选择模型,并保留基线挑战者,它就很有价值。应询问候选算法、超参数设置、失败回退方式以及用户能否复现选择结果。
Test grain, hierarchy, and reconciliation测试粒度、层级与协调
Forecasts often need to add up across SKU, brand, category, location, region, channel, customer, and enterprise levels. Bottom-up forecasts can be noisy; top-down allocation can hide local patterns; independent forecasts can be incoherent. Test bottom-up, top-down, middle-out, and reconciliation behavior using the levels where decisions occur.
预测通常需要在 SKU、品牌、品类、地点、区域、渠道、客户与企业层级之间可加总。自下而上可能噪声很大;自上而下可能掩盖局部模式;独立预测则可能不协调。应在实际决策层级测试自下而上、自上而下、中间层展开与层级协调。
Aggregation changes metric behavior. An accurate monthly category forecast can coexist with poor weekly SKU-location forecasts because positive and negative errors cancel. Require results at the grain, horizon, and lead-time bucket that drive action, plus rollups for governance.
聚合会改变指标表现。由于正负误差抵消,准确的月度品类预测可能与糟糕的每周 SKU-地点预测同时存在。应要求在驱动行动的粒度、周期与提前期分组上报告结果,并提供治理所需汇总。
Demand forecast accuracy formulas需求预测准确率公式
| Metric指标 | Formula公式 | Use and caution用途与注意 |
|---|---|---|
| MAE | Σ|error| ÷ n | Average unit error; scale-dependent平均单位误差;受规模影响 |
| WAPE | Σ|error| ÷ Σactual × 100 | Portfolio-relative error; hides item mix and fails if total actual is zero组合相对误差;会掩盖品项结构,实际合计为零时失效 |
| Bias % | Σerror ÷ Σactual × 100 | Direction of systematic error; cancellation is intentional系统性误差方向;有意保留正负抵消 |
| RMSE | √(Σerror² ÷ n) | Penalizes large misses; sensitive to outliers更惩罚大误差;对异常值敏感 |
| MAPE | Mean(|error ÷ actual|) × 100 | Readable percentage but unstable or undefined near zero百分比易读,但接近零时不稳定或无定义 |
Do not call 100 − MAPE or 100 − WAPE “accuracy” without a precise policy. The transformation can become negative, behave poorly around zero, and encourage misleading averaging. Report error, bias, coverage, and business outcomes directly.
不要在没有明确政策时把 100 − MAPE 或 100 − WAPE 称为“准确率”。这种转换可能变成负数、在零值附近表现不良,并诱导错误平均。更稳妥的做法是直接报告误差、偏差、覆盖与业务结果。
Interactive forecast error calculator交互式预测误差计算器
Enter equal-length comma-separated actual and forecast series. The example represents six periods and uses forecast minus actual for bias.
输入长度相同、用逗号分隔的实际与预测序列。示例包含六个期间,并使用“预测减实际”计算偏差。
This calculator validates arithmetic, not whether the periods, versions, cutoffs, units, or forecast horizon are comparable. Use frozen historical forecasts rather than forecasts regenerated after actuals were known.
计算器只能验证算术,不能判断期间、版本、截点、单位或预测周期是否可比。应使用历史截点冻结的预测,而不是在已知实际结果后重新生成的预测。
Use rolling, time-ordered backtesting使用滚动、按时间排序的回测
Random train/test splits can leak future structure into a forecasting evaluation. Recreate the decision repeatedly: train only on information available at each historical cutoff, forecast the required horizon, compare with later actuals, roll the cutoff forward, and aggregate results by decision-relevant segment.
随机训练/测试划分可能把未来结构泄漏到预测评估中。应重复重现真实决策:只使用每个历史截点当时可用的信息训练,预测所需周期,与随后实际值比较,再向前滚动截点,并按与决策相关的分组汇总结果。
Compare every candidate with frozen baselines such as last period, same period last year, and the current production forecast. Separate model-selection data from final evaluation where feasible. Include regime changes, promotions, new items, intermittent demand, and recent periods without tuning directly to the final test.
每个候选模型都应与冻结基线比较,例如上一期、去年同期和当前生产预测。条件允许时,将模型选择数据与最终评估数据分开。测试应包含结构变化、促销、新品、间歇需求和近期期间,但不要直接对最终测试集调参。
Capabilities to verify in demand forecasting tools需求预测工具需要验证的能力
- Data preparation: calendars, missing values, outliers, stockouts, lost sales, event flags, units, lifecycle, and hierarchy changes.数据准备:日历、缺失值、异常、缺货、损失销售、事件标记、单位、生命周期与层级变化。
- Model portfolio: transparent baselines, statistical, causal, machine-learning, intermittent, and probabilistic methods with reproducible selection.模型组合:透明基线、统计、因果、机器学习、间歇和概率方法,并可复现选择过程。
- Scale and hierarchy: required series count, runtime, reconciliation, cold-start logic, fallback, and sparse-data behavior.规模与层级:所需序列数、运行时间、协调、新品冷启动、回退与稀疏数据表现。
- Evaluation: rolling backtests, baseline comparison, metrics by horizon and segment, uncertainty calibration, and reproducible versions.评估:滚动回测、基线比较、按周期与分组的指标、不确定性校准和可复现版本。
- Interpretation: drivers, event effects, confidence, override comparison, exception reasons, and audit trail.解释:驱动因素、事件效应、置信度、人工调整比较、异常原因与审计轨迹。
- Operations: scheduling, monitoring, APIs or exports, failure recovery, access control, lineage, retraining, and change approval.运营:调度、监控、API 或导出、失败恢复、访问控制、血缘、重训与变更批准。
Build a weighted selection scorecard建立加权选型评分卡
| Dimension维度 | Weight权重 | Required evidence所需证据 |
|---|---|---|
| Out-of-sample performance样本外表现 | 25% | Rolling backtest by horizon, segment, and baseline按周期、分组与基线的滚动回测 |
| Data and pattern fit数据与形态适配 | 20% | Representative edge-case results代表性边界案例结果 |
| Model governance and explanation模型治理与解释 | 15% | Version, lineage, driver, override, approval evidence版本、血缘、驱动、调整与批准证据 |
| Usability and workflow fit易用性与流程适配 | 15% | Timed tasks with actual users真实用户限时任务 |
| Integration and operations集成与运营 | 15% | Measured effort, runtime, monitoring, recovery实测工作量、运行时间、监控与恢复 |
| Commercial and delivery fit商业与交付适配 | 10% | TCO, contract, implementation, supportTCO、合同、实施与支持 |
Weighted score = Σ(score ÷ maximum score × weight). Keep mandatory gates outside the total: data residency, access control, critical integration, minimum accuracy improvement, runtime, or auditability should not be traded away by a strong presentation score.
加权得分 = Σ(得分 ÷ 最高分 × 权重)。强制门槛应独立于总分:数据驻留、访问控制、关键集成、最低准确性提升、运行时间或可审计性,不应被优秀的演示得分抵消。
Run a proof of concept that can fail运行一个允许失败的 POC
- Freeze decisions and acceptance criteria.冻结决策与验收标准。 Specify grain, horizons, cutoffs, segments, baselines, metrics, runtime, users, and gates.明确粒度、周期、截点、分组、基线、指标、运行时间、用户与门槛。
- Create representative cohorts.建立代表性队列。 Include high-volume, long-tail, intermittent, seasonal, promoted, new, constrained, and discontinued items.包含高销量、长尾、间歇、季节、促销、新品、受限与停产品。
- Provide point-in-time data.提供历史时点数据。 Reconstruct what was actually known at each cutoff and prevent leakage.重建每个截点真正已知的信息并防止泄漏。
- Run identical rolling backtests.运行相同滚动回测。 Compare vendor models, production forecast, and naive baselines with the same rules.用相同规则比较候选模型、生产预测与朴素基线。
- Test operational tasks.测试运营任务。 Measure setup, explanation, exception review, override, export, rerun, and recovery.测量设置、解释、异常复核、调整、导出、重跑与恢复。
- Review errors, not just averages.复核误差,而不只看平均值。 Inspect large misses, bias, zero demand, coverage, excluded series, and business cost.检查大误差、偏差、零需求、覆盖、排除序列与业务成本。
- Recalculate TCO and rollout risk.重算 TCO 与上线风险。 Include data work, integrations, licenses, compute, users, implementation, support, and internal ownership.包括数据工作、集成、许可、计算、用户、实施、支持与内部责任。
Hypothetical POC comparison假设 POC 比较示例
Suppose a frozen seasonal-naive baseline produces 18% WAPE and +6% bias across the decision-weighted POC cohort. Candidate A produces 14% WAPE and +1% bias; Candidate B produces 12% WAPE and −2% bias. Those figures are hypothetical, not benchmarks.
假设冻结的季节朴素基线在按决策权重构建的 POC 队列上产生 18% WAPE 与 +6% 偏差;候选 A 为 14% WAPE 与 +1% 偏差;候选 B 为 12% WAPE 与 −2% 偏差。这些数字只是示例,不是行业基准。
Candidate B does not automatically win. It may exclude more intermittent series, need unavailable promotion data, run too slowly, or provide weak lineage. The team should compare coverage, error distributions, horizons, operational tasks, total cost, and whether the measured difference changes decisions enough to justify complexity.
候选 B 并不会自动胜出。它可能排除了更多间歇序列、依赖无法获得的促销数据、运行过慢或血缘薄弱。团队应比较覆盖、误差分布、预测周期、运营任务、总成本,以及实测差异是否足以改变决策并证明复杂性合理。
Implement and monitor the forecast system实施并监控预测系统
Start with a bounded decision and a versioned data contract. Establish owners for source quality, features, model selection, forecast approval, integration, incidents, overrides, and realized value. Parallel-run the new forecast against the current process before allowing it to influence high-risk decisions.
从范围明确的决策和版本化数据合同开始。明确源质量、特征、模型选择、预测批准、集成、事件、人工调整与价值实现的负责人。在让新预测影响高风险决策前,应与当前流程并行运行。
Monitor input completeness, feature drift, forecast availability, runtime, fallback rate, interval coverage, error and bias by horizon, baseline performance, override frequency, forecast value added, adoption, and downstream outcome metrics. Trigger review when business regimes, assortments, channels, policies, or data definitions change—not only on a fixed retraining schedule.
监控输入完整性、特征漂移、预测可用性、运行时间、回退率、区间覆盖、按周期的误差与偏差、基线表现、人工调整频率、预测增值、采用率和下游结果指标。当业务环境、商品结构、渠道、政策或数据定义变化时触发复核,而不仅依赖固定重训周期。
Common software selection mistakes常见软件选型错误
- Choosing the lowest in-sample error instead of a time-ordered out-of-sample result.选择样本内误差最低的模型,而不是按时间排序的样本外结果。
- Using one metric across stable, intermittent, new, promoted, and low-volume demand.对稳定、间歇、新品、促销与低量需求统一使用单一指标。
- Measuring at a level where errors cancel rather than where decisions occur.在误差会抵消的汇总层级衡量,而不是在决策发生层级衡量。
- Treating stock-constrained shipments as unconstrained demand without correction.未经修正就把受库存限制的发货量当作无约束需求。
- Buying “AI” without a baseline, reproducible model selection, or fallback behavior.没有基线、可复现模型选择与回退机制,就购买“AI”。
- Ignoring forecast version, cutoff, horizon, units, excluded series, and data leakage.忽视预测版本、截点、周期、单位、排除序列与数据泄漏。
- Assuming better statistical error automatically improves inventory, service, or margin.假设统计误差改善会自动改善库存、服务或利润。
Where InfiniSynapse can support analysisInfiniSynapse 可以支持哪些分析
InfiniSynapse can be considered as an analysis layer for exploring connected forecast versions, actual demand, product and location dimensions, events, notes, and business evidence. Teams can compare segments, investigate error patterns, inspect exceptions, and prepare governed summaries from data they are authorized to use.
InfiniSynapse 可作为分析层,用于探索相互关联的预测版本、实际需求、产品与地点维度、事件、备注和业务证据。团队可以比较不同分组、调查误差形态、检查异常,并基于获准使用的数据准备有治理依据的摘要。
Boundary: InfiniSynapse is not presented here as a statistical forecasting engine, automated model-selection service, demand-planning workflow, replenishment optimizer, purchasing system, supply planner, or ERP transaction/writeback tool. Forecast generation and operational execution must be verified separately.
边界:本文不把 InfiniSynapse 描述为统计预测引擎、自动模型选择服务、需求计划工作流、补货优化器、采购系统、供应计划器或 ERP 交易/回写工具。预测生成与运营执行需要分别核实。
Prepare a governed forecast analysis准备一项有治理依据的预测分析
Bring frozen forecast versions, actual demand, product and location mappings, calendar, event flags, model metadata, decision cutoffs, horizons, and metric definitions. Use InfiniSynapse to explore the connected evidence and determine where analysis can support your forecasting review.
准备冻结的预测版本、实际需求、产品与地点映射、日历、事件标记、模型元数据、决策截点、周期和指标定义。使用 InfiniSynapse 探索关联证据,并判断分析能够为预测复核提供哪些支持。
Try InfiniSynapse Online在线体验 InfiniSynapseDemand forecasting software FAQ需求预测软件常见问题
It prepares demand data, compares models, and produces time-phased point or probabilistic demand estimates at defined business levels.
它处理需求数据、比较模型,并在定义好的业务层级生成按时间展开的点预测或概率需求估计。
Forecasting estimates demand; planning usually adds overrides, collaboration, scenarios, approvals, consensus, and links to other plans.
预测估计需求;计划通常还增加人工调整、协作、情景、审批、共识及与其他计划的连接。
Use a governed set such as MAE, WAPE, bias, and a zero-safe intermittent-demand measure at the decision grain and horizon.
在决策粒度与周期上使用 MAE、WAPE、偏差以及适用于零值和间歇需求的受治理指标组合。
Use rolling time-ordered backtests, frozen baselines, representative edge cases, real user tasks, and measured integration and TCO evidence.
使用滚动时间回测、冻结基线、代表性边界案例、真实用户任务以及实测集成与 TCO 证据。
No. It must demonstrate out-of-sample improvement against relevant baselines without leakage and with acceptable operational cost.
不能。它必须在无泄漏的样本外评估中相对相关基线证明提升,并具有可接受的运营成本。
No. It is positioned here as an analysis layer, not a forecasting engine, planning workflow, replenishment optimizer, purchasing system, or ERP execution tool.
不是。这里将其定位为分析层,而不是预测引擎、计划工作流、补货优化器、采购系统或 ERP 执行工具。
Sources and limitations来源与局限
Primary technical references: Microsoft guidance on designing forecast models, the scikit-learn time-series evaluation example, and SAP guidance on measuring forecast accuracy. Sources were reviewed August 18, 2026.
主要技术参考:Microsoft 预测模型设计指南、scikit-learn 时间序列评估示例以及 SAP 预测准确性衡量指南。来源核验于 2026 年 8 月 18 日。
Software capabilities, algorithms, pricing, integrations, and product boundaries change. This vendor-neutral framework is not a current vendor ranking, product certification, forecast guarantee, financial projection, or procurement recommendation. Verify shortlisted products with current documentation, contracts, security review, representative data, and your own acceptance criteria.
软件能力、算法、价格、集成与产品边界会变化。本厂商中立框架不是实时厂商排名、产品认证、预测保证、财务预测或采购推荐。应通过最新文档、合同、安全审查、代表性数据与自身验收标准验证入围产品。