 InfiniSynapse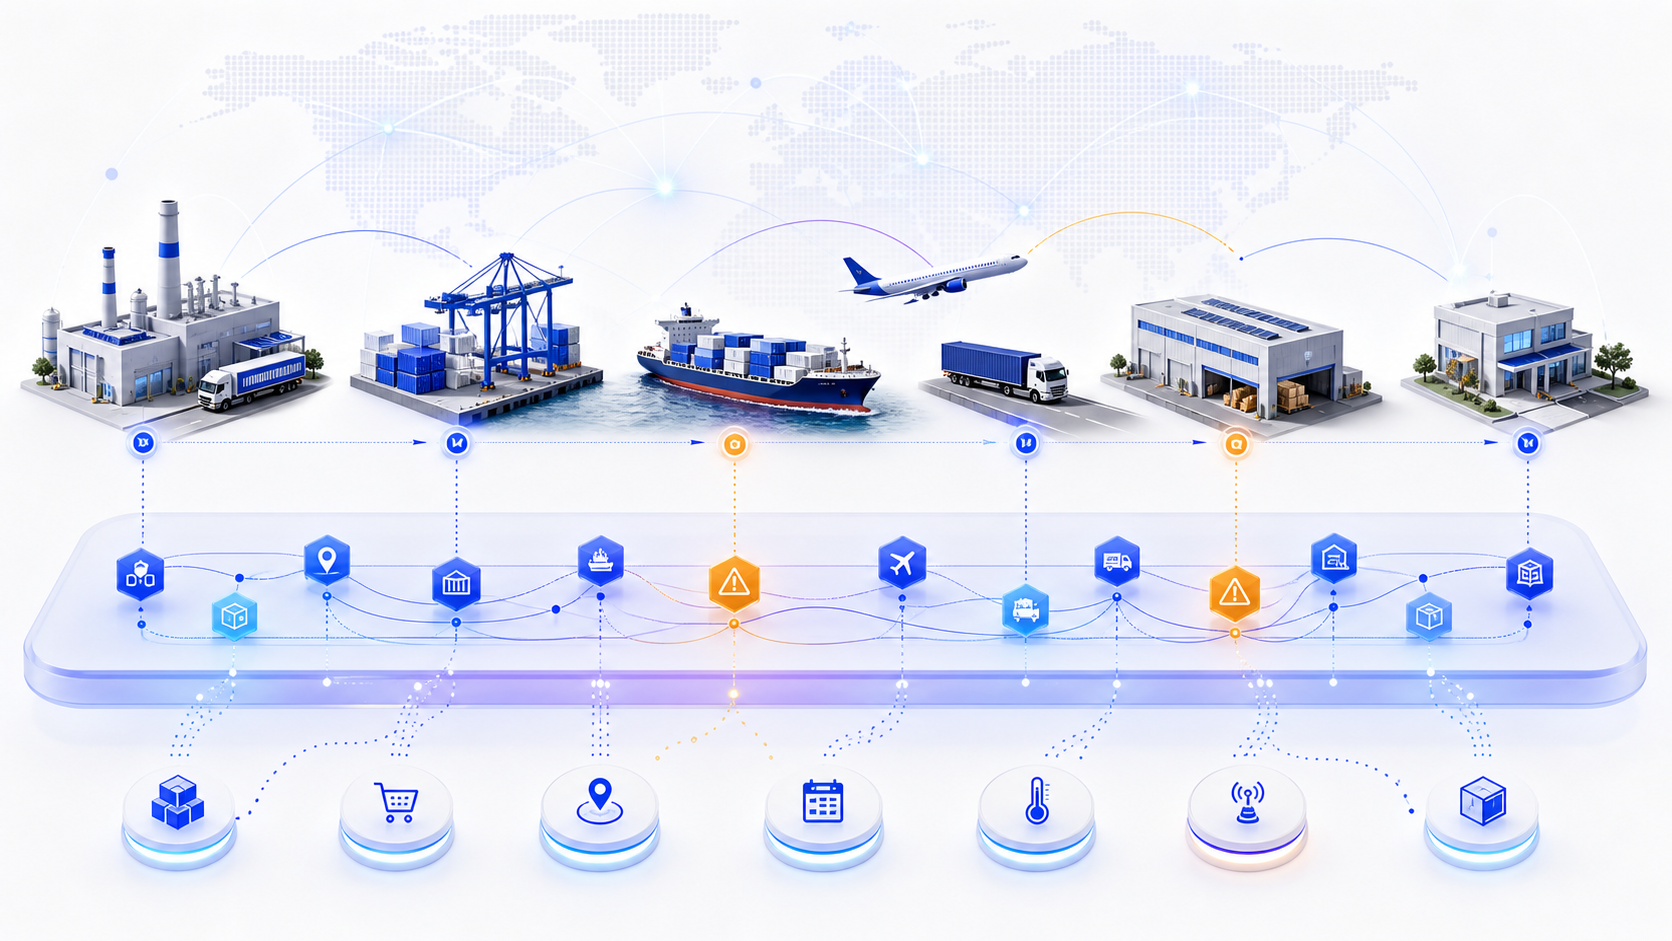
What is supply chain visibility software?什么是供应链可视化软件?
Supply chain visibility software connects operational events from internal systems and trading partners so teams can understand the status, location, timing, condition, and business context of orders, inventory, shipments, materials, or assets.
供应链可视化软件连接企业内部系统和贸易伙伴的运营事件,使团队能够理解订单、库存、运输、物料或资产的状态、位置、时间、状况和业务背景。
The useful outcome is not “seeing everything.” It is knowing enough, soon enough, to answer a defined question: Which customer orders are at risk? Where is constrained inventory? Which supplier milestone is missing? Which shipment ETA changed? What evidence supports the exception, and who needs to decide?
真正有用的结果不是“看到一切”,而是在足够早的时间获得足够信息,从而回答明确问题:哪些客户订单有风险?紧缺库存在哪里?哪个供应商里程碑缺失?哪批货的 ETA 发生变化?异常有什么证据?谁需要作出决定?
This makes the category broader than shipment tracking but narrower than an all-purpose supply chain suite. Some products specialize in transport; others cover orders, inventory, suppliers, production milestones, traceability, risk, or multi-enterprise control-tower use cases. Buyers must define the required scope before comparing products.
因此,这一类别比运输跟踪更广,但又不是包办一切的供应链套件。有些产品专注运输,有些覆盖订单、库存、供应商、生产里程碑、追溯、风险或多企业控制塔。买方必须先定义范围,再比较产品。
Start with the visibility decision从需要改善的决策开始
Bookings, milestones, carrier events, ETAs, dwell, route deviations, and delivery exceptions.
订舱、里程碑、承运事件、ETA、滞留、路线偏差与交付异常。
Order status, allocations, available inventory, backorders, receipts, and customer promise risk.
订单状态、分配、可用库存、欠交、收货与客户承诺风险。
PO confirmations, component readiness, production milestones, quality holds, and upstream delays.
采购订单确认、部件准备、生产里程碑、质量冻结与上游延迟。
Object identity, chain of custody, lot history, aggregation, temperature, shock, and certification events.
对象身份、监管链、批次历史、包装聚合、温度、震动与认证事件。
A narrow, high-value decision is often a better first deployment than a vague end-to-end mandate. For example, “identify inbound component shipments likely to miss production need dates at least 24 hours earlier” is testable. “Create one version of supply chain truth” is not an acceptance criterion by itself.
与模糊的端到端目标相比,一个范围较窄、价值较高的决策往往更适合作为首个部署场景。例如,“至少提前 24 小时识别可能错过生产需求日的入厂部件运输”可以测试;“建立供应链唯一真相”本身并不是验收标准。
Build visibility from trustworthy events用可信事件建立可视性
Visibility software needs more than connectors. It must identify the object, normalize events, preserve timestamps, map partner and location identities, relate parent and child objects, infer missing milestones carefully, and distinguish observed facts from predictions. A status without provenance is difficult to audit.
可视化软件不只是连接器。它必须识别对象、标准化事件、保留时间戳、映射伙伴和地点身份、关联父子对象、谨慎推断缺失里程碑,并区分已观察事实与预测。没有来源依据的状态很难审计。
| Question问题 | Typical fields典型字段 | Validation concern验证重点 |
|---|---|---|
| What? | Order, line, SKU, lot, pallet, container, asset订单、订单行、SKU、批次、托盘、集装箱、资产 | Stable identity and hierarchy身份与层级是否稳定 |
| Where? | Site, port, lane, coordinates, business location站点、港口、线路、坐标、业务地点 | Location mapping and time zone地点映射与时区 |
| When? | Event time, record time, planned and predicted time事件时间、记录时间、计划与预测时间 | Freshness, sequence, late-arriving events新鲜度、顺序与迟到事件 |
| Why? | Business step, disposition, status, exception reason业务步骤、处置、状态、异常原因 | Shared vocabulary and provenance统一词汇与来源 |
| How? | Sensor, method, condition, certification传感器、方法、状态、认证 | Units, calibration, permissions单位、校准与权限 |
GS1's EPCIS and Core Business Vocabulary provide a standards-based example of this approach: a common model for sharing visibility events across applications and enterprises, including the what, when, where, why, and how of products and assets. A buyer does not always need EPCIS, but should ask how the proposed platform represents equivalent concepts.
GS1 的 EPCIS 与核心业务词汇展示了这种标准化方法:通过共同模型在应用和企业之间共享可视化事件,描述产品和资产的 what、when、where、why 与 how。买方不一定必须采用 EPCIS,但应询问候选平台如何表达这些等价概念。
Capabilities to evaluate需要评估的能力
- Source and partner coverage: ERP, OMS, WMS, TMS, supplier, carrier, forwarder, EDI, API, file, portal, IoT, and public data where relevant.来源与伙伴覆盖:根据场景连接 ERP、OMS、WMS、TMS、供应商、承运商、货代、EDI、API、文件、门户、IoT 与公共数据。
- Event normalization: identity resolution, milestone mapping, deduplication, sequence correction, unit conversion, and provenance.事件标准化:身份解析、里程碑映射、去重、顺序修正、单位转换与来源追踪。
- Current state and history: a defensible latest status plus the event trail and plan revisions that produced it.当前状态与历史:提供可辩护的最新状态,以及形成该状态的事件轨迹与计划修订。
- Prediction and exception logic: ETA or risk prediction with confidence, reason, threshold, suppression, and feedback controls.预测与异常逻辑:ETA 或风险预测应包含置信度、原因、阈值、抑制与反馈控制。
- Analysis: filters, drill-down, segment comparison, lead-time and dwell distributions, root-cause evidence, and exportable audit trails.分析:筛选、下钻、分组比较、交期与滞留分布、根因证据和可导出审计轨迹。
- Governance and security: role-based access, tenant and partner boundaries, retention, lineage, regional requirements, monitoring, and change control.治理与安全:角色权限、租户与伙伴边界、保留期、血缘、区域要求、监控与变更控制。
Visibility platform vs TMS, ERP, and control tower可视化平台与 TMS、ERP、控制塔的区别
| Category类别 | Primary role主要角色 | Typical strength典型优势 | Question to ask应询问的问题 |
|---|---|---|---|
| ERP / OMS | System of record and transactions记录与交易系统 | Orders, financial and master data订单、财务与主数据 | How are external events represented?如何表达外部事件? |
| WMS / TMS | Warehouse or transport execution仓储或运输执行 | Operational planning and transactions运营计划与交易 | How broad is partner and mode coverage?伙伴与运输模式覆盖多广? |
| Visibility platform可视化平台 | Unify and interpret cross-system events统一并解释跨系统事件 | Status, prediction, exceptions, evidence状态、预测、异常与证据 | What is observed, inferred, and missing?哪些是观察、推断与缺失? |
| Control tower控制塔 | Monitor and support cross-functional decisions监控并支持跨职能决策 | Scenario, collaboration, prioritization情景、协作与优先级 | Does it execute actions or only recommend?它执行动作还是只给建议? |
“End-to-end” and “real time” are not binary product properties. End-to-end coverage depends on your lanes, tiers, partners, identifiers, and events. Real-time value depends on how quickly a decision must be made. Require a coverage matrix and measured latency distribution rather than accepting a label.
“端到端”和“实时”不是简单的产品属性。端到端覆盖取决于企业的线路、层级、伙伴、标识和事件;实时价值取决于决策时限。应要求候选方提供覆盖矩阵与实测延迟分布,而不是接受一个标签。
Prepare a testable requirements document准备可测试的需求文档
For each use case, document the persona, decision, object, origin and destination, transport modes, regions, partners, sources, required events, refresh need, exception threshold, desired response, security boundary, retention period, output, and measurable baseline. Classify requirements as mandatory, differentiating, or future—not simply “important.”
针对每个场景,记录角色、决策、对象、起点与终点、运输模式、地区、伙伴、数据源、必需事件、刷新需求、异常阈值、期望响应、安全边界、保留期、输出和可量化基线。将需求分为强制、差异化和未来需求,而不是全部标为“重要”。
Also provide representative edge cases: split shipments, revised promises, transshipment, late events, cancelled orders, missing milestones, duplicate identifiers, cross-dock flows, partial receipts, returns, clock changes, and partner-specific codes. These reveal data-model and exception weaknesses that a polished happy-path demo can hide.
还应提供有代表性的边界案例:拆分运输、承诺变更、中转、迟到事件、取消订单、缺失里程碑、重复标识、越库流程、部分收货、退货、时钟变化和伙伴自定义代码。这些场景能暴露精心设计的顺利流程演示所掩盖的数据模型与异常处理弱点。
Score evidence, not presentation quality评价证据,而不是演示效果
| Dimension维度 | Example weight示例权重 | Evidence证据 |
|---|---|---|
| Source and partner coverage来源与伙伴覆盖 | 20% | Coverage matrix using actual lanes and partners基于实际线路与伙伴的覆盖矩阵 |
| Event quality and identity事件质量与身份 | 20% | Accuracy, duplication, missingness, lineage准确率、重复、缺失与血缘 |
| Exceptions and prediction异常与预测 | 15% | Precision, recall, lead time, explanation精确率、召回率、提前量与解释 |
| Analytics and usability分析与易用性 | 15% | Timed business tasks and user feedback限时业务任务与用户反馈 |
| Integration and operations集成与运维 | 10% | Build effort, monitoring, recovery, change control建设工作量、监控、恢复与变更控制 |
| Security and governance安全与治理 | 10% | Architecture, access tests, audit and retention架构、访问测试、审计与保留 |
| Commercial and delivery fit商业与交付适配 | 10% | TCO, contract, implementation and support modelTCO、合同、实施与支持模式 |
Weighted score = Σ (dimension score ÷ maximum score × dimension weight). Set mandatory gates separately: a product should not win by total points if it fails a critical security, data-residency, partner-coverage, or accuracy requirement.
加权得分 = Σ(维度得分 ÷ 最高分 × 维度权重)。强制门槛应单独设置:如果产品未满足关键安全、数据驻留、伙伴覆盖或准确性要求,就不应仅凭总分胜出。
Run a proof of concept with representative data使用代表性数据运行 POC
- Freeze scope and success criteria.冻结范围与成功标准。 Select two or three decisions, users, lanes, partners, and measurable outcomes.选择两三个决策、用户、线路、伙伴和可量化结果。
- Create a truth set.建立真实对照集。 Sample observed milestones, exceptions, ETAs, and outcomes from source evidence.从源证据中抽样已观察里程碑、异常、ETA 与结果。
- Connect real extracts.连接真实数据样本。 Include normal records, missing data, duplicates, revisions, and edge cases.包含正常记录、缺失、重复、修改与边界案例。
- Measure the pipeline.测量数据管道。 Quantify coverage, freshness, identity match, event accuracy, and lineage.量化覆盖率、新鲜度、身份匹配、事件准确性与血缘。
- Test user decisions.测试用户决策。 Time realistic tasks and record false alerts, missed risks, and manual work.为真实任务计时,并记录误报、漏报与人工工作。
- Test failure and governance.测试失败与治理。 Simulate delayed feeds, schema changes, access boundaries, and recovery.模拟数据延迟、模式变化、访问边界与恢复。
- Recalculate value and TCO.重新计算价值与 TCO。 Replace sales assumptions with measured adoption, effort, and outcome evidence.用实测采用率、工作量与结果证据替换销售假设。
Measure visibility quality and business outcomes同时衡量可视性质量与业务结果
A visibility program needs leading data and adoption metrics before claiming lagging business value. Useful measures include source and partner coverage, event completeness, event latency percentiles, identity-match rate, ETA error, exception precision and recall, warning lead time, alert acknowledgment, active-user adoption, time to investigate, and percentage of exceptions with auditable evidence.
在声称最终业务价值之前,可视化项目需要先衡量领先的数据质量与采用指标。可用指标包括数据源与伙伴覆盖、事件完整率、事件延迟分位数、身份匹配率、ETA 误差、异常精确率与召回率、预警提前量、告警确认率、活跃用户采用率、调查时间及具有可审计证据的异常比例。
Outcome measures depend on the selected decision: expediting cost, premium freight, demurrage or detention, inventory buffers, shortage hours, service failures, manual status inquiries, time to resolution, and customer promise performance. Use a baseline, comparison cohort, or staged rollout where feasible; a before-and-after change alone may reflect seasonality or network mix.
结果指标取决于所选决策,可包括加急费用、高价运输、滞箱或滞期、库存缓冲、缺料小时、服务失败、人工状态查询、解决时间和客户承诺表现。条件允许时,应使用基线、对照队列或分阶段上线;单纯上线前后变化可能受季节性或网络结构影响。
Supply chain visibility software ROI formula供应链可视化软件 ROI 公式
For an initial model, value per event can combine avoidable investigation labor and service-recovery or expediting cost. Add other benefits only when their baselines and attribution rules are defensible. Total investment should include recurring software and data-network fees, implementation, integration, internal labor, change management, support, and ongoing data operations.
在初步模型中,单次事件价值可由可避免的调查人工和服务补救或加急成本组成。只有在基线与归因规则可靠时,才加入其他收益。总投资应包括经常性软件与数据网络费用、实施、集成、内部人工、变更管理、支持和持续数据运营。
All default values are hypothetical and use generic currency units. This calculator is a screening model, not a forecast or promise. Replace assumptions with measured POC and finance-approved values, run conservative and downside scenarios, and avoid counting the same benefit in multiple categories.
所有默认值均为假设,使用通用货币单位。该计算器是筛选模型,不是预测或承诺。应替换为 POC 实测与财务批准数据,运行保守和下行情景,并避免在多个类别重复计算同一收益。
Hypothetical business case example假设商业案例示例
Assume 1,200 addressable exceptions per year. Each requires four investigation hours at 65 currency units per hour and 500 units of recovery or expedite cost. If a measured POC supports a 25% addressable reduction, annual gross benefit is 1,200 × (4 × 65 + 500) × 25% = 228,000.
假设每年有 1,200 个可改善异常,每个异常需要 4 小时调查,小时综合成本为 65 个货币单位,并产生 500 个单位的补救或加急成本。如果 POC 实测支持 25% 的可改善比例,则年度毛收益为 1,200 ×(4 × 65 + 500)× 25% = 228,000。
With 90,000 annual recurring cost, 120,000 one-time implementation cost, and a three-year horizon, investment is 390,000 and gross benefit is 684,000. Illustrative net benefit is 294,000, simple ROI is 75.4%, and payback after launch is about 10.4 months if benefit accrues evenly. A real model should phase adoption, account for implementation time, and discount cash flows where required.
若年度经常性成本为 90,000,一次性实施成本为 120,000,分析周期为三年,则总投资为 390,000,毛收益为 684,000。示例净收益为 294,000,简单 ROI 为 75.4%;若收益均匀产生,上线后的回收期约为 10.4 个月。真实模型还应考虑采用率爬坡、实施周期,并按要求折现现金流。
Test integration, security, and operating ownership测试集成、安全与运营责任
Map every interface by owner, direction, method, frequency, volume, schema, identity key, error handling, monitoring, recovery objective, and change process. Confirm how historical backfill, deletions, corrections, late events, and partner onboarding work. A simple API count says little about implementation effort.
按负责人、方向、方式、频率、数据量、模式、身份键、错误处理、监控、恢复目标与变更流程映射每个接口。确认历史回填、删除、修正、迟到事件和伙伴接入如何处理。API 数量本身并不能说明实施工作量。
Security review should cover data classification, encryption, identity and access, partner-level segregation, support access, audit logs, retention and deletion, regional hosting, subprocessors, incident response, business continuity, export, and termination. Define who owns source quality, mapping, alert rules, model monitoring, user support, and value tracking after go-live.
安全审查应覆盖数据分类、加密、身份与访问、伙伴级隔离、支持访问、审计日志、保留与删除、区域托管、分包商、事件响应、业务连续性、导出与终止。还要定义上线后谁负责源数据质量、映射、告警规则、模型监控、用户支持与价值跟踪。
Implement in decision-sized releases按决策规模分阶段实施
Foundation: establish identity, source contracts, event vocabulary, baseline metrics, governance, and a small truth set. Pilot: deploy one decision across representative partners and measure data, user, and outcome performance. Scale: add lanes, partners, objects, modes, and user groups with reusable onboarding and monitoring. Operate: review data drift, alert quality, adoption, cost, and realized value on a fixed cadence.
基础阶段:建立身份、数据源合同、事件词汇、基线指标、治理与小型真实对照集。试点阶段:在有代表性的伙伴范围内上线一个决策,并衡量数据、用户与结果表现。扩展阶段:通过可复用接入和监控增加线路、伙伴、对象、模式与用户组。运营阶段:按固定节奏复盘数据漂移、告警质量、采用率、成本与已实现价值。
Do not wait for perfect global data, but do not scale an untrusted signal. Publish coverage and freshness alongside operational views, route uncertain predictions differently from confirmed events, and give users a feedback mechanism for false or missing exceptions.
不要等待全球数据达到完美,但也不要扩展不可信的信号。应在运营视图旁同步展示覆盖与新鲜度,把不确定预测与已确认事件按不同方式处理,并为用户提供误报与漏报反馈机制。
Common selection and rollout mistakes常见选型与上线错误
- Buying a global map before defining the decision, object, and required events.还未定义决策、对象与必需事件,就先购买全球地图。
- Treating “real time” as a feature without measuring source latency and decision need.把“实时”当作功能标签,却不测量源延迟与决策需求。
- Evaluating only clean demo data instead of real missing, duplicate, revised, and late events.只评估干净演示数据,不测试真实的缺失、重复、修订与迟到事件。
- Confusing visibility with execution, then discovering that recommended actions still need another system and owner.混淆可见性与执行,后来才发现建议动作仍需另一个系统和负责人。
- Ignoring partner onboarding, data-network fees, internal data operations, and change-management cost.忽视伙伴接入、数据网络费用、内部数据运营与变更管理成本。
- Sending every exception to every user, creating alert fatigue and workarounds.把所有异常发给所有用户,造成告警疲劳与绕行流程。
- Claiming ROI from modeled benefits without measured adoption, attribution, or finance validation.在没有实测采用率、归因或财务验证时,就用模型收益声称 ROI。
Where InfiniSynapse can fitInfiniSynapse 可以发挥作用的位置
InfiniSynapse can be considered as an analysis layer for exploring connected order, inventory, supplier, shipment, receipt, document, and exception evidence. Teams can compare segments, investigate operational questions, inspect outliers, and prepare governed summaries from the data they are authorized to use.
InfiniSynapse 可作为分析层,用于探索相互关联的订单、库存、供应商、运输、收货、文档与异常证据。团队可以比较不同分组、调查运营问题、检查异常值,并基于获准使用的数据准备有治理依据的摘要。
Boundary: InfiniSynapse is not presented here as a TMS, WMS, OMS, carrier network, supplier portal, IoT platform, planning engine, shipment booking tool, workflow orchestrator, or ERP transaction/writeback system. Source connectivity and operational actions must be verified separately.
边界:本文不把 InfiniSynapse 描述为 TMS、WMS、OMS、承运商网络、供应商门户、IoT 平台、计划引擎、运输订舱工具、工作流编排器或 ERP 交易/回写系统。数据源连接与运营动作需要分别核实。
Prepare a visibility analysis use case准备一个可视化分析场景
Bring a defined decision, sample order and event data, partner and source list, current baseline, known exceptions, security constraints, and expected output. Use InfiniSynapse to explore the connected evidence and determine where analysis can support your visibility workflow.
准备明确的决策、订单与事件样本、伙伴和数据源清单、当前基线、已知异常、安全约束与期望输出。使用 InfiniSynapse 探索关联证据,并判断分析能够在可视化工作流中提供哪些支持。
Try InfiniSynapse Online在线体验 InfiniSynapseSupply chain visibility software FAQ供应链可视化软件常见问题
It combines internal and partner events to show the status, location, timing, condition, and context of supply chain objects.
它整合内部与伙伴事件,展示供应链对象的状态、位置、时间、状况与业务背景。
Depending on the use case: orders, inventory, POs, production milestones, bookings, carrier events, ETAs, receipts, master data, sensors, and exception reasons.
视场景而定,通常包括订单、库存、采购订单、生产里程碑、订舱、承运事件、ETA、收货、主数据、传感器与异常原因。
No. Define freshness from the decision window; some exceptions need event-driven updates, while other reviews can use hourly or daily data.
不一定。应从决策时限确定新鲜度;有些异常需要事件驱动更新,另一些复盘使用小时或每日数据即可。
Use representative POC data and score coverage, event quality, identity, latency, exceptions, analytics, usability, security, integration, TCO, and outcomes.
使用代表性 POC 数据,评估覆盖、事件质量、身份、延迟、异常、分析、易用性、安全、集成、TCO 与结果。
Visibility platforms unify and interpret events; control towers usually add cross-functional decision support and sometimes workflow. Vendor definitions vary.
可视化平台统一并解释事件;控制塔通常增加跨职能决策支持,有时还包含工作流。厂商定义并不统一。
No. It is positioned here as an analysis layer, not a TMS, WMS, OMS, carrier network, portal, planning engine, or ERP execution system.
不是。这里将其定位为分析层,而不是 TMS、WMS、OMS、承运商网络、门户、计划引擎或 ERP 执行系统。
Sources and limitations来源与局限
Primary references: the GS1 EPCIS and CBV implementation guideline, the EPCIS 2.0.1 standard, and AWS guidance for supply chain control tower visibility. Sources were reviewed August 18, 2026.
主要参考资料:GS1 EPCIS 与 CBV 实施指南、EPCIS 2.0.1 标准以及 AWS 供应链控制塔可视化指南。来源核验于 2026 年 8 月 18 日。
Capabilities, data networks, pricing, deployment models, regions, and product boundaries change. This page provides a vendor-neutral evaluation framework, not a current vendor ranking, product certification, financial forecast, security approval, legal advice, or procurement recommendation. Verify shortlisted products directly with current documentation, contracts, architecture review, references, and your own data.
能力、数据网络、价格、部署模式、区域和产品边界会变化。本文提供厂商中立的评估框架,不是实时厂商排名、产品认证、财务预测、安全批准、法律意见或采购推荐。应通过最新文档、合同、架构审查、客户参考和自身数据直接验证入围产品。