 InfiniSynapse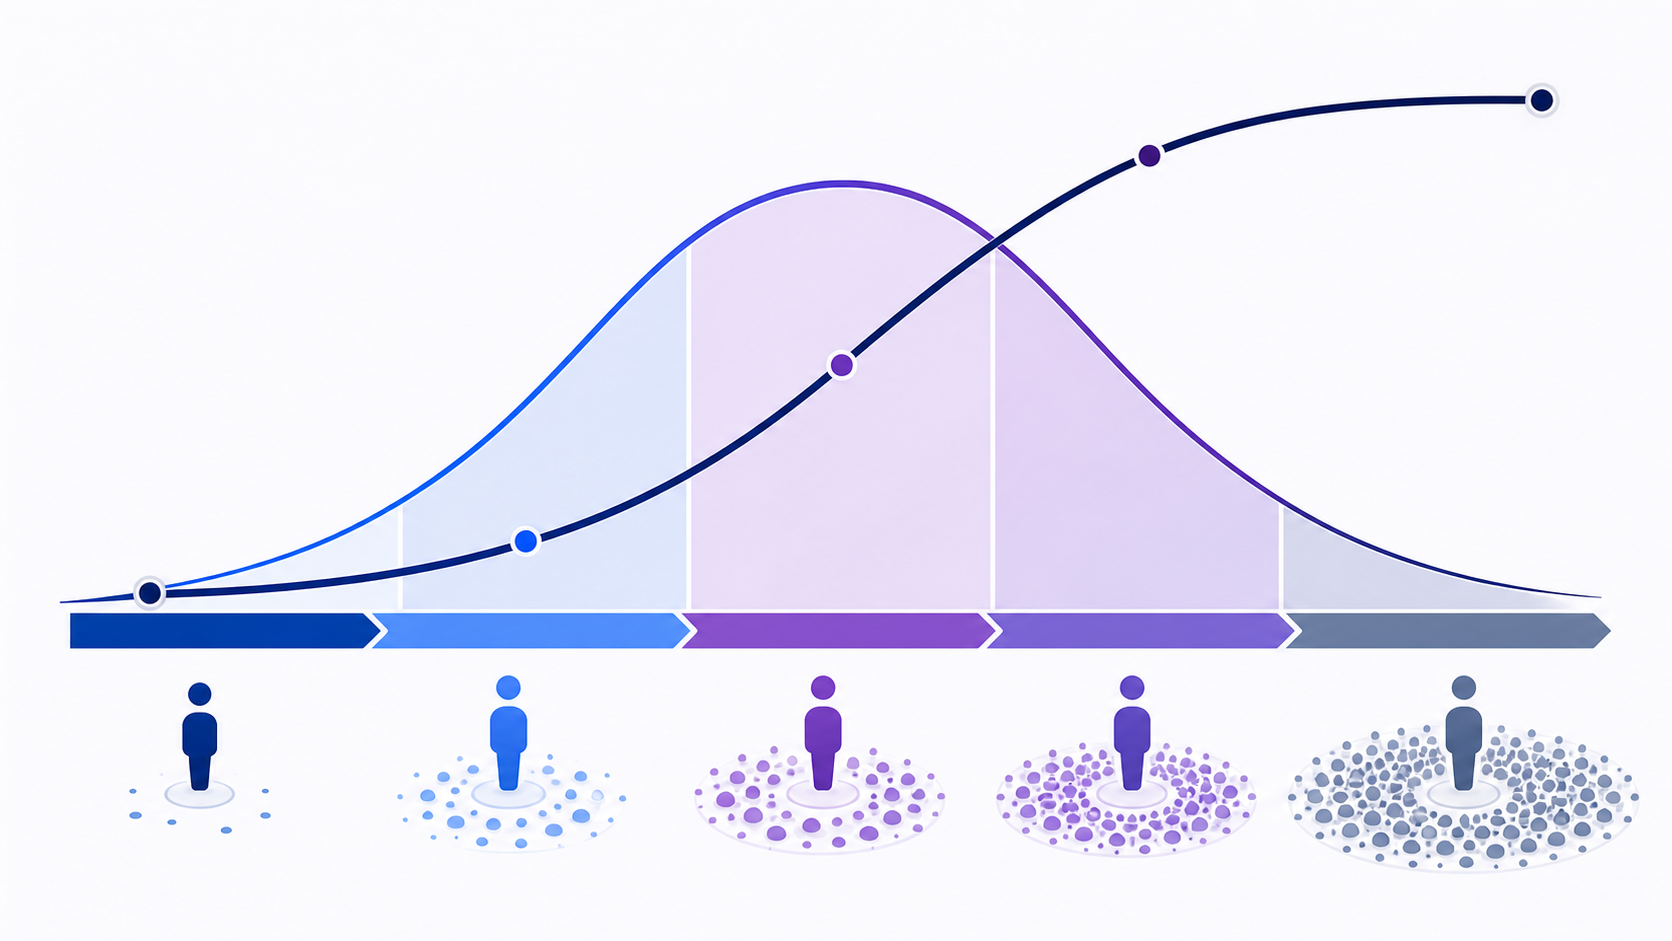
What is the product adoption curve?什么是产品采用曲线?
The product adoption curve is a diffusion model that groups a population by relative adoption timing: innovators, early adopters, early majority, late majority and laggards. The five groups are commonly drawn as a bell-shaped distribution. When you chart the cumulative share that has adopted over time, the result is an S-curve: slow initial growth, faster expansion, then a plateau.
产品采用曲线是一种扩散模型,按相对采用时间把总体分为创新者、早期采用者、早期大众、晚期大众和滞后者。五类人群通常绘制成钟形分布;若绘制随时间累计采用的比例,则形成 S 曲线:早期增长缓慢,随后加速,最终趋于平台。
The diagram is only a starting point. Teams still need to decide which audience needs experimentation, which needs proof and reliability, whether the product has reached the mainstream, and what evidence supports that judgment. The model is a strategic lens—not a measurement system by itself. A signup date or feature click does not automatically identify a person as an “innovator.” You need a defined market, a meaningful adoption event, time-aware cohorts, and qualitative evidence about needs and risk tolerance.
这张图只是起点。团队仍需判断哪些受众愿意试验、哪些受众需要证据与可靠性、产品是否进入主流,以及判断依据是什么。该模型是一种策略视角,本身不是测量系统。注册日期或一次功能点击不能自动把某人归为“创新者”;你需要明确市场、定义有价值的采用事件、建立带时间维度的同期群,并补充有关需求和风险偏好的定性证据。
Read the product adoption curve correctly正确解读产品采用曲线
Two pictures are often called the adoption curve, but they show different quantities. The bell curve shows the distribution of adopters by when they adopt; each band represents a share of the eventual adopter population. The cumulative S-curve adds those adopters over time. Its slope is the rate of new adoption: flat when adoption is slow, steep when many people adopt, and flat again as the addressable population becomes saturated.
“采用曲线”常指两种图,但它们表示不同量。钟形曲线展示采用者按采用时间的分布,每一段代表最终采用总体的一部分;累计 S 曲线则把采用者随时间累加。S 曲线的斜率代表新增采用速度:采用缓慢时较平,集中采用时变陡,接近可触达市场饱和时再次变平。
| Model模型 | Question answered回答的问题 | Typical axes常见坐标 | Main risk主要风险 |
|---|---|---|---|
| Adopter bell curve采用者钟形曲线 | Who adopts relatively early or late?谁相对较早或较晚采用? | Adoption timing × share of adopters采用时间 × 采用者占比 | Treating categories as fixed personalities把类别当作固定人格 |
| Cumulative S-curve累计 S 曲线 | How much of the defined population has adopted?已定义总体中有多少已经采用? | Time × cumulative adoption时间 × 累计采用 | Using an unstable denominator使用不断变化的分母 |
| Product life cycle产品生命周期 | How is the product progressing commercially?产品在商业上如何演进? | Time × sales, profit or category demand时间 × 销售、利润或品类需求 | Assuming adoption and revenue peak together假设采用与收入同时见顶 |
The Gartner Hype Cycle is different again: it describes expectations around an emerging technology, not the distribution of adopters. A product can experience high expectations while meaningful adoption remains low. Choose the diagram that matches the decision rather than borrowing whichever curve looks persuasive.
Gartner 技术成熟度曲线又是另一种模型:它描述对新兴技术的预期,而不是采用者分布。某项产品可能获得很高期待,但有意义的采用仍然较低。应按决策问题选择图形,而不是借用看起来更有说服力的曲线。
Product adoption curve stages and practical needs产品采用曲线五个阶段与实际需求
The familiar percentages—2.5%, 13.5%, 34%, 34% and 16%—describe segments of an idealized normal distribution in diffusion theory. They are a reference model, not a quota your live customer base must match. Category size and timing can differ when network effects, regulation, procurement, price, geography or access shape adoption.
常见的 2.5%、13.5%、34%、34% 和 16% 来自扩散理论中的理想化正态分布。它们是参考模型,并非真实客户群必须满足的配额。当网络效应、监管、采购、价格、地域或可获得性影响采用时,各类别的规模和时间都可能不同。
| Category类别 | Reference share参考占比 | What they often need常见需求 | Useful evidence and action有用证据与行动 |
|---|---|---|---|
| Innovators创新者 | 2.5% | Access, flexibility and room to experiment访问权、灵活性和试验空间 | Recruit design partners; observe failure modes; avoid generalizing from enthusiasts招募共同设计伙伴;观察失败模式;不要把爱好者结论推广到所有人 |
| Early adopters早期采用者 | 13.5% | A meaningful advantage and strategic fit显著优势与战略适配 | Validate the core outcome; document credible use patterns and objections验证核心结果;记录可信使用模式与反对意见 |
| Early majority早期大众 | 34% | Proof, reliability, compatibility and support证据、可靠性、兼容性与支持 | Reduce setup risk; standardize onboarding; show relevant peer evidence降低设置风险;标准化引导;展示相关同类证据 |
| Late majority晚期大众 | 34% | Low risk, simplicity, affordability and norms低风险、简单、可负担与行业惯例 | Simplify migration; clarify cost; provide dependable defaults简化迁移;明确成本;提供可靠默认设置 |
| Laggards滞后者 | 16% | Continuity, necessity or a safe transition连续性、必要性或安全过渡 | Offer compatibility and support; do not force change without a clear case提供兼容与支持;没有充分理由时不要强制改变 |
Avoid moral labels. “Late” does not mean irrational, and “early” does not mean profitable. A regulated enterprise may wait because switching risk is high; an enthusiast may adopt immediately but never become a durable customer. Segment by observed constraints and decisions, not stereotypes.
避免道德化标签。“较晚”不代表不理性,“较早”也不代表有利润。受监管企业可能因切换风险高而等待;爱好者可能立即采用,却从未成为长期客户。应按可观察的约束和决策分群,而不是按刻板印象。
When the adoption curve helps—and when it does not采用曲线何时有用,何时不适用
Use it to examine why an innovation moves from tolerant experimenters to risk-sensitive mainstream buyers, and to adjust proof, packaging, channels, onboarding and support.
用它分析创新为何从能容忍试验的人群扩展到更关注风险的主流买家,并调整证据、包装、渠道、引导和支持。
Use launch-wave or first-adoption cohorts to test whether later groups need different setup, integrations, trust evidence or service levels.
使用发布批次或首次采用同期群,检验后续人群是否需要不同设置、集成、信任证据或服务水平。
The curve does not prove why adoption accelerated. Pricing, distribution, mandates, seasonality, product quality and competitor changes may be responsible.
曲线不能证明采用为何加速;价格、分销、强制要求、季节性、产品质量和竞争变化都可能是原因。
Do not classify an individual from one click or signup. Category labels are relative to a defined innovation and social system, and behavior can change across products.
不要凭一次点击或注册给个人分类。类别只相对于特定创新和社会系统,同一人的行为也会因产品而变。
For in-product features, a product analytics workflow may be more useful than the market-level model. Feature eligibility, exposure, discovery, first use and repeated value can be measured directly. The adoption curve can frame a hypothesis about diffusion, but the operational analysis should use clear event definitions and cohorts.
对于产品内功能,产品分析工作流可能比市场层模型更有用。功能资格、曝光、发现、首次使用和重复价值可以直接测量。采用曲线能帮助提出扩散假设,但实际分析仍应使用清晰事件定义和同期群。
Prepare evidence before drawing an adoption curve绘制采用曲线前准备证据
Start by writing a metric contract. Define the innovation, geographic or account market, eligible population, unit of analysis, adoption event, observation window and exclusions. “Uses the product” is too vague. A B2B collaboration product might define account adoption as at least three eligible teammates completing the core shared workflow in two separate weeks within 30 days of activation. That definition is an editorial example, not a universal benchmark.
先编写指标契约:定义创新、地域或账户市场、合格总体、分析单位、采用事件、观察窗口和排除条件。“使用产品”过于模糊。一个 B2B 协作产品可把账户采用定义为:激活后 30 天内,至少三名合格成员在两个不同周完成核心共享工作流。这是编辑示例,不是通用基准。
- Required fields: stable user or account ID, eligibility date, first qualifying adoption timestamp, source or segment, and the fields needed to verify the value event.必需字段:稳定用户或账户 ID、合格日期、首次满足采用条件的时间戳、来源或分群,以及验证价值事件所需字段。
- Helpful context: plan, company size, geography, acquisition channel, invitation or referral links, product version, integrations, onboarding path and support interactions.有用上下文:套餐、公司规模、地域、获客渠道、邀请或推荐关系、产品版本、集成、引导路径和客服互动。
- Governance: consent and permitted purpose, identity resolution rules, time zone, bot or test-account filters, retention policy, and a source-total reconciliation.治理要求:同意与允许用途、身份解析规则、时区、机器人或测试账户过滤、保留政策,以及与源系统总量对账。
Critical limitation: a product event table can show adoption timing and behavior, but it rarely reveals the total addressable market or a buyer's true risk attitude. Combine behavioral evidence with market sizing, interviews, win/loss research and channel data. Label inference as inference.
关键局限:产品事件表能展示采用时间和行为,却很少直接给出可触达市场总量或买家的真实风险态度。应结合市场规模、访谈、赢单/失单研究和渠道数据,并把推断明确标为推断。
How to measure a product adoption curve如何测量产品采用曲线
- Define adoption and eligibility.定义采用与合格条件。Choose one decision, one unit, a value-based event or event sequence, and a fixed window. Freeze the denominator for each reported cohort.选择一个决策、一个单位、基于价值的事件或事件序列及固定窗口;为每个报告同期群固定分母。
- Build first-adoption cohorts.建立首次采用同期群。For every eligible unit, find the first timestamp that satisfies the adoption contract. Group by week or month, keeping non-adopters in the denominator.为每个合格单位找到首次满足采用契约的时间戳,按周或月分组,并让未采用者保留在分母中。
- Plot distribution and cumulative views.绘制分布与累计视图。Show new adopters per interval and cumulative adopted share. Add uncertainty or data-completeness notes instead of smoothing away missing periods.同时展示每个时间段新增采用者和累计采用比例;标注不确定性与数据完整性,不要用平滑处理掩盖缺失时段。
- Segment using observable evidence.按可观察证据分群。Compare source, needs, company size, integrations, setup effort, procurement time and repeated value. Do not assign Rogers labels from timing alone.比较来源、需求、公司规模、集成、设置成本、采购周期和重复价值;不要只凭时间分配 Rogers 类别。
- Test stage-specific hypotheses.检验阶段特定假设。State what would disconfirm the diagnosis. If the early majority is blocked by reliability, error and support data should improve with reliability work—not only signups.明确哪些结果会推翻诊断。若早期大众受可靠性阻碍,可靠性改进后应同时改善错误与支持数据,而不只是注册量。
- Review, document and repeat.复核、记录并重复。Reconcile source totals, inspect identity joins, annotate launches and pricing changes, and rerun on a fixed schedule. Preserve definitions so curve changes reflect users rather than query drift.核对源系统总量、检查身份连接、标注发布与价格变化,并按固定节奏重跑;保留定义,确保曲线变化来自用户而非查询漂移。
Metrics that make the curve actionable让采用曲线可行动的指标
A product adoption rate formula is useful only after its nouns are defined: adopted eligible units ÷ eligible units × 100 for a stated window. Pair this rate with breadth, depth, time and duration. One aggregate percentage can rise while an important new segment fails to activate or returns only once.
只有定义清楚各项含义后,产品采用率公式才有用:在明确窗口内,已采用的合格单位 ÷ 合格单位 × 100。应同时观察广度、深度、时间和持续性。总体比例可能上升,但某个重要新分群仍可能未激活,或只回来一次。
| Metric指标 | Definition定义 | Decision use决策用途 | Caution注意 |
|---|---|---|---|
| Adoption rate采用率 | Adopted eligible units / eligible units已采用合格单位 / 合格单位 | Track reach within a defined population跟踪已定义总体中的覆盖 | Eligibility and event definitions control the result合格与事件定义决定结果 |
| Time to adoption采用耗时 | Eligibility to first qualifying value从合格到首次满足价值条件 | Find setup or trust friction发现设置或信任阻力 | Right-censor incomplete cohorts处理未成熟同期群的右删失 |
| Repeated value重复价值 | Qualifying use across required periods跨规定时段满足使用条件 | Separate trial from durable adoption区分试用与持续采用 | Frequency must fit the use case频率必须匹配使用场景 |
| Cohort retention同期群留存 | Share returning after first value首次价值后再次返回的比例 | Compare adoption quality by wave比较不同采用批次的质量 | Avoid comparing immature cohorts避免比较尚未成熟的同期群 |
| Segment coverage分群覆盖 | Adoption by need, channel or account type按需求、渠道或账户类型计算采用 | Test mainstream expansion hypotheses检验主流扩展假设 | Protect privacy and minimum sample sizes保护隐私并设置最小样本量 |
Use cohort analysis to compare launch waves, funnel analysis to locate pre-adoption friction, and a documented retention-rate formula to check whether adoption persists.
Example: interpreting an adoption curve without inventing certainty示例:在不虚构确定性的前提下解读采用曲线
Hypothetical example: a B2B workflow product launches an optional approval feature. The team defines eligible accounts as those with at least five active members and adoption as two different approvers completing approved requests in two separate weeks within 45 days. Early invite-only accounts adopt quickly, but the next acquisition wave reaches the setup screen and stops. Interviews cite unclear permissions and missing audit exports.
假设示例:某 B2B 工作流产品发布可选审批功能。团队把合格账户定义为至少有五名活跃成员,并把采用定义为:45 天内,两名不同审批人在两个不同周完成审批请求。早期邀请账户很快采用,但下一批获客账户到达设置页面后停止。访谈指出权限不清晰且缺少审计导出。
The safe observation is that the later cohort has lower qualified adoption and higher setup abandonment. A reasonable inference is that mainstream-oriented accounts may require clearer governance and compatibility evidence. It is not yet a fact that the product has “crossed the chasm” or that every non-adopter belongs to the early majority. The team could simplify role templates, clarify audit behavior, and test the change with a comparable cohort while monitoring errors, support requests and repeated value.
安全的观察结论是:后续同期群的合格采用率更低,设置放弃率更高。合理推断是:更偏主流的账户可能需要更清晰的治理与兼容性证据。但这仍不能证明产品已经“跨越鸿沟”,也不能证明所有未采用者都属于早期大众。团队可简化角色模板、说明审计行为,并用可比同期群检验改动,同时监控错误、支持请求和重复价值。
Validation succeeds only if the setup-stage difference narrows for comparable eligible accounts without increasing permission errors or weakening repeated use. If adoption does not improve, interview the affected segment again and examine alternative causes such as pricing, implementation ownership or acquisition quality. The curve organizes the investigation; it does not replace it.
只有在可比合格账户中,设置阶段差距缩小,且权限错误未增加、重复使用未变弱,才可认为验证成功。若采用没有改善,应再次访谈相关分群,并检查价格、实施责任或获客质量等替代原因。曲线用于组织调查,不能替代调查。
Analyze adoption cohorts across connected data跨已连接数据分析采用同期群
Before opening the tool, prepare a read-only database or warehouse connection—or structured files—with stable user or account IDs, eligibility dates, timestamped value events, segment fields and a written adoption definition. InfiniSynapse can support natural-language analysis across connected structured data and produce reviewable queries, tables, charts and explanations.
打开工具前,请准备只读数据库或数据仓库连接,或结构化文件;其中应包含稳定用户或账户 ID、合格日期、带时间戳的价值事件、分群字段和书面采用定义。InfiniSynapse 可支持对已连接结构化数据进行自然语言分析,并生成可审查的查询、表格、图表和解释。
Ask for new adopters by interval, cumulative adoption, time-to-adoption distributions and cohort retention, then inspect generated logic, joins, denominators, source coverage and assumptions. The application supports analysis; it is not an instrumentation SDK, survey platform, market-sizing source or automatic proof that a cohort matches a Rogers category.
可要求生成分时段新增采用者、累计采用、采用耗时分布和同期群留存,然后检查生成逻辑、连接、分母、来源覆盖和假设。该应用用于辅助分析;它不是埋点 SDK、问卷平台、市场规模来源,也不会自动证明某个同期群符合 Rogers 类别。
Analyze structured adoption data with InfiniSynapse使用 InfiniSynapse 分析结构化采用数据Common mistakes, limits and result checks常见错误、局限与结果检查
- Changing the denominator: cumulative adoption looks stronger if eligibility silently shrinks. Version every metric contract and display eligible counts beside rates.更改分母:如果合格总体悄然缩小,累计采用看起来会更强。应为每版指标契约留存版本,并在比例旁显示合格数量。
- Calling activation adoption: first value is useful, but durable adoption may require repeated value or account-level spread. Report the stages separately.把激活称为采用:首次价值很重要,但持续采用可能需要重复价值或账户内扩散。应分别报告各阶段。
- Forcing the textbook percentages: real markets need not match 2.5/13.5/34/34/16. Use them as theory, not fit targets.强行匹配教科书比例:真实市场不必符合 2.5/13.5/34/34/16。它们是理论参考,不是拟合目标。
- Inferring motives from timestamps: early timing does not prove risk tolerance. Add interviews, research and buying-context evidence.从时间戳推断动机:较早采用不能证明风险偏好。应补充访谈、研究和购买情境证据。
- Ignoring censoring and seasonality: recent cohorts have had less time to adopt, while campaigns and renewals can create artificial waves. Compare equally mature windows and annotate interventions.忽略删失与季节性:近期同期群拥有的采用时间更少,活动与续约也会制造人为波动。应比较成熟度一致的窗口并标注干预。
- Claiming causality from shape: an S-curve does not identify the cause of growth. Use controlled tests where feasible and triangulate with operational evidence.从形状声称因果:S 曲线不能识别增长原因。可行时使用受控测试,并与运营证据交叉验证。
Before sharing a result, verify that every local and source table reconciles, IDs are unique at the chosen unit, timestamps use the intended zone, adoption events meet the written contract, recent cohorts are marked incomplete, and charts label units, windows and exclusions. Reproduce at least one cohort from source rows. Have the decision owner confirm what action would change under each plausible interpretation.
分享结果前,应核对所有本地表与源表总量,确认所选单位下 ID 唯一、时间戳采用正确时区、采用事件符合书面契约、近期同期群标为未成熟,并在图表中标注单位、窗口与排除项。至少从源记录复现一个同期群,并让决策负责人确认在不同合理解释下会采取什么行动。
Best practices and next steps最佳实践与下一步
Keep the model useful by tying every label to an observable hypothesis. Describe a group as “accounts adopting within 30 days through partner referrals” before calling it an early-adopter proxy. Maintain both the interval distribution and cumulative view. Review acquisition, activation, repeated value and retention together, because rapid top-of-funnel growth can hide weak durable adoption.
要让模型保持有用,应把每个标签连接到可观察假设。先把群体描述为“通过伙伴推荐并在 30 天内采用的账户”,再考虑是否将其作为早期采用者代理。应同时维护分时段分布和累计视图,并一起检查获客、激活、重复价值和留存,因为漏斗顶部快速增长可能掩盖持续采用薄弱。
Treat stage strategy as a set of testable choices. Early groups may reveal capabilities and failure modes; mainstream groups may need dependable workflows, integrations, security review, documentation and support. Later groups may value migration safety and continuity. Verify these needs locally instead of copying generic personas. Protect non-adopters from unnecessary outreach and respect privacy, accessibility and procurement constraints.
把阶段策略视为一组可检验选择。早期人群可能揭示能力与失败模式;主流人群可能需要可靠工作流、集成、安全审查、文档和支持;较晚人群可能更重视迁移安全与连续性。应在本地验证这些需求,而不是复制通用画像,并避免对未采用者进行不必要触达,尊重隐私、无障碍和采购限制。
A practical next step is to select one innovation, write the adoption contract, build two equal-maturity cohorts, and produce both new-adopter and cumulative curves. Add three competing explanations for the observed shape and the evidence that would distinguish them. Only then choose a product, marketing or customer-success action.
可执行的下一步是:选择一项创新,写出采用契约,建立两个成熟度一致的同期群,并同时生成新增采用与累计采用曲线。针对观察到的形状列出三个相互竞争的解释,以及区分它们所需证据;然后再选择产品、营销或客户成功行动。
Product adoption curve FAQ产品采用曲线常见问题
What is the product adoption curve?什么是产品采用曲线?
The product adoption curve is a diffusion model that groups potential adopters by how early they adopt an innovation: innovators, early adopters, early majority, late majority and laggards. The category distribution is commonly shown as a bell curve; cumulative adoption over time is shown as an S-curve.
产品采用曲线是一种扩散模型,按采用创新的早晚把潜在采用者分为创新者、早期采用者、早期大众、晚期大众和滞后者。类别分布通常画成钟形曲线,随时间累计的采用则画成 S 曲线。
What are the five stages of the product adoption curve?产品采用曲线的五个阶段是什么?
The five adopter categories are innovators, early adopters, early majority, late majority and laggards. They describe relative adoption timing within a social system, not guaranteed personalities or a mandatory sequence for every individual.
五类采用者是创新者、早期采用者、早期大众、晚期大众和滞后者。它们描述特定社会系统内的相对采用时间,不代表固定人格,也不意味着每个人都必须经历同样顺序。
How do you know where a product is on the adoption curve?如何判断产品处于采用曲线哪个位置?
Define the eligible market and a meaningful adoption event, chart first adoption by cohort and time, add evidence about segment needs and buying behavior, and compare alternative explanations. Product telemetry alone cannot prove a Rogers category.
先定义合格市场和有意义的采用事件,按同期群与时间绘制首次采用,再加入分群需求和购买行为证据,并比较替代解释。仅凭产品遥测无法证明 Rogers 类别。
Is the product adoption curve the same as the product life cycle?产品采用曲线与产品生命周期相同吗?
No. The adoption curve describes who adopts and when, while the product life cycle describes a product's commercial progression through introduction, growth, maturity and decline. The timelines can interact but answer different questions.
不同。采用曲线描述谁在何时采用,产品生命周期描述产品在商业上经历导入、增长、成熟和衰退的过程。两条时间线可能相互影响,但回答不同问题。
How is product adoption rate calculated?产品采用率如何计算?
A practical product adoption rate is adopted eligible users divided by eligible users, multiplied by 100, for a stated time window. Teams must define eligibility, the qualifying value event, unit of analysis and repeat-use requirement before calculating it.
实用的产品采用率是在明确时间窗口内,用已采用的合格用户除以合格用户,再乘以 100。计算前必须定义合格条件、满足采用的价值事件、分析单位和重复使用要求。
Authoritative sources and evidence notes权威来源与证据说明
The adopter categories, reference shares and innovation characteristics were checked against the OpenStax Principles of Marketing adoption chapter. The strategic relationship among adopter groups was compared with Virginia Tech's innovation strategy chapter. The distinction between an adopter distribution and cumulative diffusion was cross-checked with the MIT OpenCourseWare technology-adoption lecture.
采用者类别、参考比例和创新特征核对了 OpenStax《营销原理》的采用章节;各类采用者之间的策略关系对照了弗吉尼亚理工大学创新战略章节;采用者分布与累计扩散的区别还参考了 MIT OpenCourseWare 技术采用讲义。
The measurement workflow, B2B example, comparison table and validation checklist are editorial synthesis. The example is explicitly hypothetical.
测量工作流、B2B 示例、比较表和验证清单属于编辑整理;示例已明确标为假设。