What is total cost of ownership?
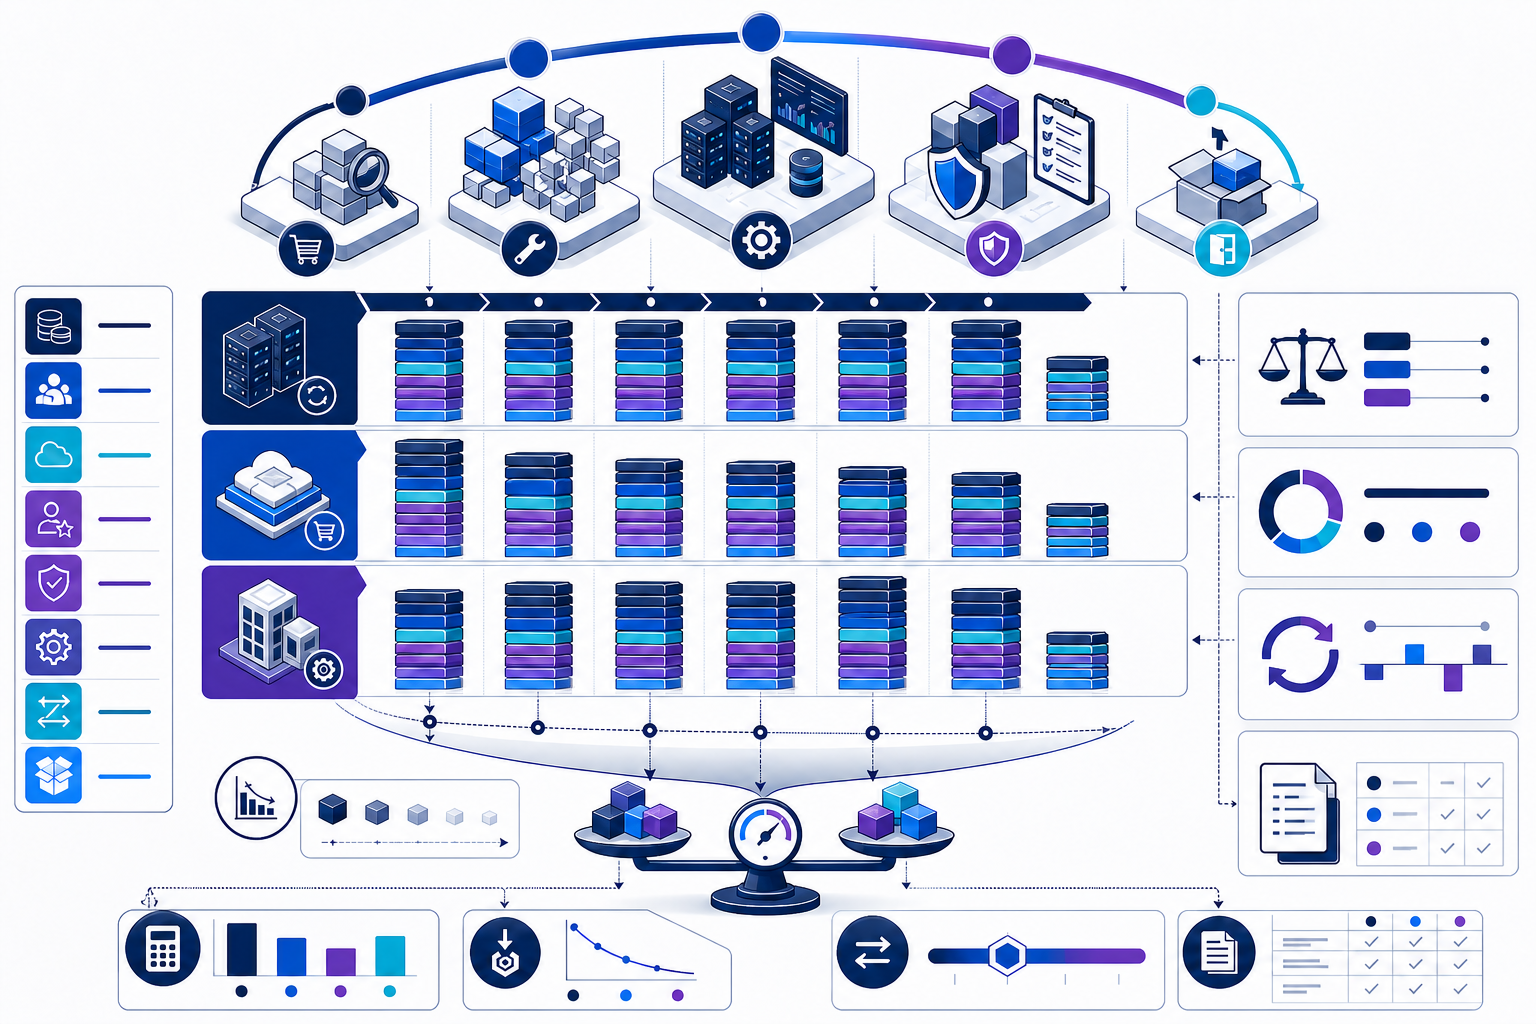
Total cost of ownership (TCO) is the complete cost of acquiring, implementing, operating, maintaining, governing, changing, and retiring a system over a defined lifecycle, net of approved residual value. In the hypothetical five-year comparison on this page, nominal TCO is $12.25 million to continue the current system, $10.33 million to buy a platform, and $12.17 million to build internally. At an illustrative 8% real discount rate, present-value TCO is $9.72 million, $8.43 million, and $10.08 million respectively.
The purchased platform is the lowest-cost option in this model, but TCO alone does not make it the preferred decision. Cost ranking is valid only if the options deliver comparable accepted output, service, control, security, adaptability, and risk. If outcomes differ, compare incremental value and risk as well as cost.
Use a total cost of ownership formula that preserves timing
Nominal TCO =
  acquisition + implementation + migration
  + operation + internal labor + governance
  + maintenance + expected risk + exit
  − residual value and approved credits

Present-value TCO =
  Σ [(cost in period t − residual value in period t)
     ÷ (1 + discount rate)^t]

Equivalent annual cost =
  present-value TCO ÷ annuity factor
Do not collapse every number into a single undiscounted total too early. Preserve period, currency, price basis, owner, source, confidence, and cost behavior. A time-phased model supports budgets, present-value comparison, contract timing, and variance analysis.
Distinguish TCO from price, ROI, payback, and cost-benefit analysis
| Measure | Question answered | What it contains | What it cannot decide alone |
|---|---|---|---|
| Purchase price | What is the quoted external price? | License, subscription, or contract line items | Internal, lifecycle, risk, and exit cost |
| TCO | What resources will this option consume over its lifecycle? | Complete cost within the defined boundary | Whether the outcome is worth the cost |
| ROI | How large is net benefit relative to cost? | Benefits and a cost denominator, often supplied by TCO | Absolute value, timing, or all nonmonetized effects |
| Payback | When do cumulative benefits recover investment? | Time-phased net cash flows | Value after payback |
| Cost-benefit analysis | Which alternative creates the greatest net value? | Costs, benefits, timing, uncertainty, and alternatives | Feasibility or non-negotiable risk without separate evidence |
Use TCO to complete the cost side of an investment case. Then use the ROI example or cost-benefit analysis example when value differs across options.
Define the decision, lifecycle, and equivalent service
The example asks how to provide 18,000 accepted AI-assisted analysis outputs per year for five operating years. Each option must meet the same acceptance, latency, availability, data-access, human-review, security, privacy, and audit requirements. Year zero contains transition cost; years one through five contain operation; year five includes exit or retirement.
Sustain the current workflow, legacy tools, contractors, remediation, and eventual retirement.
Acquire a platform, integrate and migrate, operate under subscription and usage pricing, govern the service, and preserve an exit path.
Develop and own the application, data integration, infrastructure, evaluation, maintenance, and retirement.
Benefits, unrelated enterprise programs, and unavoidable common sunk costs are reported separately from decision TCO.
Use the same TCO cost taxonomy for every option
| Cost pool | Include | Typical evidence |
|---|---|---|
| Acquisition and commercial | Procurement, legal review, licenses, subscriptions, commitments, overages, support tiers | Quote, contract, rate card, renewal terms |
| Implementation and data | Architecture, integration, migration, cleaning, labeling, validation, testing, parallel run | Work breakdown, labor plan, vendor statement |
| Infrastructure and consumption | Compute, model/API use, storage, data transfer, observability, environments, backup | Usage telemetry, bill, allocation tags, forecast |
| People and process | Engineering, analysis, product, operations, human review, support, training, change | Role plan, fully loaded rate, workflow events |
| Trust, assurance, and risk | Security, privacy, evaluation, governance, audit, monitoring, incident response, residual risk | Control plan, test schedule, risk register, incident data |
| Maintenance and change | Upgrades, regression tests, model changes, dependency changes, retraining, documentation | Roadmap, backlog, historical maintenance |
| Exit and residual | Data export, migration, contract termination, retention, deletion, decommissioning, residual value | Exit plan, portability test, deletion evidence, resale or credit |
Use a cost row even when an option has zero cost in that category. A shared taxonomy makes omissions visible. It also prevents the buy case from including a vendor quote while the build case includes every internal engineer and the continue case ignores remediation.
Map cost to the lifecycle before requesting numbers
A defensible TCO starts with time and work, not a spreadsheet total. Describe what happens from the decision date through exit, assign each activity to an owner, and only then attach quantities and rates. This prevents the model from treating implementation as a one-time vendor invoice while hiding the internal work that makes the system usable.
| Lifecycle stage | Work to cost | Useful cost driver | Control question |
|---|---|---|---|
| Explore and select | Requirements, architecture, pilots, procurement, legal and risk review | People-days, pilot environments, evaluation cases | Would this work occur only because this option is chosen? |
| Implement and migrate | Integration, data preparation, migration, validation, security configuration, training | Interfaces, datasets, records, user groups, test cycles | Does the estimate include remediation and parallel operation? |
| Operate and consume | Subscriptions, API calls, compute, storage, data transfer, review, support, administration | Accepted outputs, tokens, jobs, users, retained data, support cases | Is consumption tied to a workload forecast rather than a flat guess? |
| Govern and assure | Evaluation, human oversight, monitoring, privacy, security, audit, incident response | Models, use cases, releases, controls, incidents, evidence cycles | Are mandatory controls costed as recurring operations? |
| Maintain and change | Upgrades, regression testing, retraining, data drift response, dependencies, documentation | Releases, change requests, model refreshes, defects, integration changes | Does the estimate assume the system remains static? |
| Exit or replace | Export, migration, retention, deletion, termination, decommissioning, knowledge transfer | Datasets, interfaces, applications, contracts, environments | Can data and operations actually move to the next option? |
The lifecycle is iterative. A platform upgrade can trigger fresh integration, evaluation, training, and security work. Model that work in the year it is expected rather than forcing every activity into either “implementation” or “operations.”
Write a basis of estimate that another reviewer can reproduce
Every cost row needs more than a number. Record the scope statement, quantity, unit, rate, source date, price basis, start and end period, escalation rule, probability treatment, owner, and confidence. A reviewer should be able to move from a total back to the operational assumption that created it.
Name the decision, alternatives, required outcome, organizational boundary, lifecycle, currency, and reporting date.
Decompose each option into deliverables and activities before assigning labor, consumption, and commercial cost.
Prefer actuals and signed terms, then validated telemetry and expert estimates; identify analogies and unsupported placeholders.
Tie labor to staffing plans, consumption to workload, contracts to rate cards, and totals to finance classification without changing the decision boundary.
Classify estimates as actual, committed, parametric, analogy, or expert judgment. Confidence is not a substitute for uncertainty analysis, but it tells decision-makers where validation effort has the highest value. Keep assumptions and exclusions beside the model; a polished total without them is not auditable.
Keep price basis, escalation, discounting, and currency consistent
Choose either nominal dollars with a nominal discount rate or constant dollars with a real discount rate. Do not mix general inflation into some rows while discounting with a real rate. The worked example uses hypothetical constant 2026 dollars and an illustrative 8% real rate. Annual changes represent workload, aging, contract steps, or scope—not general inflation.
| Item | Rule in this example | Reason |
|---|---|---|
| Base date | 2026 constant dollars | Keeps purchasing power comparable across years |
| Discount rate | 8% real, illustrative | Converts future resource use to the decision date |
| Timing | Year-zero cost at decision date; operating cost at year-end | Makes the discount convention explicit |
| Currency | USD; foreign quotes translated using a documented rate and date | Prevents silent foreign-exchange assumptions |
| Tax | Use organization-approved treatment consistently across options | TCO is a decision model, not an improvised tax model |
Discounting does not make future cost less real; it gives costs at different dates a common comparison basis. Keep the nominal schedule visible beside the present value so finance, procurement, and operating teams can reconcile the model to budgets and contracts.
Use one service definition for the continue, buy, and build options
The hypothetical organization needs 18,000 accepted AI-assisted analysis outputs per year for five operating years. “Accepted” means the output passes the same documented quality checks and required human review. All three alternatives must meet the same availability, response-time, data-access, privacy, security, auditability, support, and business-continuity requirements.
Decision date: beginning of year zero. Operating horizon: years one through five. Output: 90,000 accepted units in total. Price basis: constant 2026 USD. Discount rate: illustrative 8% real. Comparison rule: compare cost only after testing service equivalence.
The model excludes benefits, taxes that do not differ by option, and unavoidable enterprise overhead. It includes incremental shared-service cost when the decision increases demand. Historical spending is disclosed but excluded if it is already incurred and cannot change; reusable assets are included through their opportunity cost or residual value when evidence supports it.
Build each option from activity-level cost, not a top-down percentage
The annual schedules below are deliberately different because the options consume resources differently. Continue has no transition program but carries growing remediation and a retirement cost. Buy concentrates integration and migration in year zero, then adds subscription, internal operating labor, consumption, assurance, and exit. Build has the largest initial development burden and sustained engineering ownership.
| Option / constant USD millions | Y0 | Y1 | Y2 | Y3 | Y4 | Y5 | Nominal TCO |
|---|---|---|---|---|---|---|---|
| Continue current system | $0.000 | $2.280 | $2.348 | $2.419 | $2.491 | $2.716 | $12.255 |
| Buy platform | $1.200 | $1.740 | $1.680 | $1.730 | $1.800 | $2.180 | $10.330 |
| Build internally | $2.150 | $1.870 | $1.820 | $1.900 | $2.020 | $2.410 | $12.170 |
Continue: year one combines current software, infrastructure, internal operations, contractors, quality control, security support, and remediation. The operating base grows 3% annually because aging interfaces and manual exceptions increase work; year five also contains $150,000 for retirement. This is not “free.” It is the business-as-usual alternative against which switching cost is compared.
Buy, year zero: $60,000 procurement and legal review; $480,000 implementation and integration; $230,000 data migration and validation; $140,000 training and change; $110,000 security, privacy, and evaluation setup; and $180,000 parallel operation and disruption. These sum to $1.20 million before operation begins.
Buy, year one: $420,000 subscription and usage; $780,000 internal labor; $180,000 evaluation and governance; $90,000 support and administration; $210,000 cloud and data; and $60,000 vendor management and assurance. Later years reflect workload, contract, and maintenance changes. Year five includes $350,000 of exit work within the $2.18 million total.
Build, year zero: $1.25 million application and product development; $300,000 data and infrastructure foundation; $250,000 security and evaluation; $150,000 training and process change; and a $200,000 quantified contingency allowance. Year one contains $900,000 engineering and MLOps, $380,000 cloud/model/data, $210,000 governance and evaluation, $120,000 user support, and $260,000 maintenance and retraining.
Compare present-value TCO, equivalent annual cost, and unit cost
Present value applies the same 8% rate and timing convention to every option. Equivalent annual cost converts each five-year present value into a level annual amount using a five-year annuity factor of 3.99271. Dividing that annual amount by 18,000 accepted outputs produces a cost-effectiveness measure that is meaningful only because the output and acceptance rule are held constant.
| Option | Nominal TCO | PV TCO at 8% | Equivalent annual cost | Cost per accepted output |
|---|---|---|---|---|
| Continue | $12.255m | $9.724m | $2.436m | $135.31 |
| Buy | $10.330m | $8.431m | $2.112m | $117.32 |
| Build | $12.170m | $10.075m | $2.523m | $140.19 |
On cost alone, Buy is $1.293 million lower in present value than Continue, a margin equal to 15.3% of Buy's PV TCO. Build is $1.644 million higher than Buy. These are cost margins, not benefits. They indicate how much uncertainty or additional cost could close the gap; they do not prove that Buy creates more business value.
Translate AI demand into billable and internal cost drivers
AI cost is rarely a single price per user. Demand moves through a technical chain: business events create tasks; tasks create model calls; calls consume input and output tokens, compute, storage, retrieval, tools, and network; quality controls create retries and human review. Estimate the chain explicitly so a workload change can flow through to cost.
accepted outputs
× attempts per accepted output
× calls per attempt
× consumption per call
× unit rate
+ environments + storage + transfer + observability
+ human review + exception handling + evaluation
= workload-driven operating cost
Use distributions or workload bands when averages hide expensive tails. A small share of long-context, multimodal, agentic, or repeatedly retried tasks may drive a disproportionate share of cost. Separate development, test, evaluation, and production demand. Include peak capacity where service requirements force it, but do not multiply every row by peak volume.
Measure cost per accepted output rather than per raw call when quality matters. An apparently cheaper model can have higher TCO if it needs more retries, more reviewer time, or more remediation. Conversely, a more expensive call can reduce total cost if it improves first-pass acceptance enough to lower downstream work.
The FinOps Foundation's guidance on AI workload cost estimation emphasizes estimating cost from development and pilot through production adoption. Use that lifecycle view alongside product telemetry rather than extrapolating one pilot invoice directly to five years.
Treat AI governance as operating work and risk as uncertainty
Governance is not a ceremonial percentage added after the technology estimate. Translate controls into activities: inventory and ownership, impact assessment, data and privacy review, threat modeling, evaluation design, approval, monitoring, incident response, audit evidence, change control, and retirement. Cost the people, tools, environments, and evidence cycles required by the actual use case.
The NIST AI Risk Management Framework provides a voluntary structure for managing AI risk, while the AI RMF Playbook suggests actions across Govern, Map, Measure, and Manage. Use the controls selected by your organization to create work packages; do not claim that a dollar allowance alone satisfies the framework.
| Treatment | Use when | Modeling rule |
|---|---|---|
| Certain control cost | The activity is required under the chosen option | Put the expected labor and tool cost in the base schedule |
| Expected event cost | An event has estimable probability and consequence | Probability-weight the incremental consequence once |
| Scenario | Probability is weak or variables move together | Show discrete downside and upside cases separately |
| Contingency | Known uncertainty remains after detailed estimating | Derive from uncertainty analysis and disclose its basis |
| Constraint | A risk makes an option unacceptable regardless of cost | Treat as a feasibility gate, not a monetized offset |
Avoid double counting. If incident-response staffing is in recurring operations, do not also include the same labor inside every expected incident consequence. If schedule uncertainty is represented in a delayed-launch scenario, do not add an unsupported blanket delay percentage to the base estimate.
Allocate shared cloud, data, platform, and governance cost transparently
Shared cost should enter decision TCO when the option causes additional resource use or consumes scarce capacity. Directly attribute cost where possible. For the remainder, select a driver with a causal relationship to consumption—such as compute hours, storage, accepted outputs, model calls, support tickets, or evaluation cycles—and document the allocation rule.
allocated shared cost =
  shared cost pool
  × option's causal driver units
  ÷ total driver units served by the pool
Do not allocate every enterprise cost merely because the system exists. A fixed central team that will not change may be disclosed as common overhead but excluded from incremental decision TCO. If the option forces new staffing, licenses, or capacity, include the incremental amount. The FinOps Allocation capability provides useful practices for assigning shared technology cost transparently.
Model switching, retirement, residual value, and sunk cost separately
Exit is part of ownership. Include contract termination, data export, data validation, migration, parallel operation, user transition, retention, deletion verification, decommissioning, and knowledge transfer. Test portability before relying on a low exit estimate. A contractual export right is not the same as an operationally proven migration path.
Residual value must be evidence-based and option-specific. Reusable data pipelines, hardware, transferable licenses, documented components, and trained staff capability may retain value, but only the portion available after the analysis horizon belongs in the model. Do not assign residual value to custom code merely because development was expensive.
Sunk cost is different. Spending already incurred and unrecoverable cannot be changed by today's choice, so it should not determine the option ranking. Disclose it for context and accounting reconciliation, but compare alternatives on future avoidable and opportunity cost. A current asset that can be sold, repurposed, or consumed by another use is not fully sunk.
Test the variables that can overturn the cost ranking
A point estimate hides uncertainty. Begin with one-way sensitivity to reveal which assumptions move the result, then combine credible variables into scenarios. The table below changes one Buy assumption at a time while every other input remains at base. It is diagnostic, not a probability forecast.
| Buy case | Changed assumption | PV increase | Revised PV TCO | Remaining margin vs Continue |
|---|---|---|---|---|
| Base | No change | — | $8.431m | $1.293m |
| Consumption pressure | Usage and cloud categories +25% | $0.686m | $9.117m | $0.607m |
| Labor pressure | Internal operating labor +15% | $0.442m | $8.873m | $0.851m |
| Transition delay | Six-month parallel run adds $400,000 in year one | $0.370m | $8.802m | $0.923m |
| Exit pressure | Year-five exit cost doubles by adding $350,000 | $0.238m | $8.670m | $1.055m |
Consumption is the largest of these individual tests, yet none alone closes the $1.293 million present-value gap to Continue. That does not prove Buy is robust under every combination. A credible downside scenario could combine slower adoption, more retries, higher reviewer effort, contract escalation, and delayed retirement. Correlated variables should be modeled together rather than added as independent percentages.
Use break-even analysis to turn the margin into a decision threshold: how much additional consumption, transition effort, or exit cost would make Buy equal Continue? Then assign an owner to monitor that driver. Sensitivity becomes actionable when a threshold is tied to a contract clause, telemetry alert, staffing trigger, or stage gate.
Turn the estimate into a forecast-versus-actual control loop
TCO should not disappear after approval. Baseline the selected option, connect each major cost pool to an operational and financial source, and update forecast-to-complete at a defined cadence. Separate price variance, usage variance, staffing variance, schedule variance, scope change, and estimate error so corrective action targets the cause.
| Control field | Minimum record | Trigger example |
|---|---|---|
| Cost baseline | Approved amount by period, pool, owner, and option | Change control required before moving boundary or scope |
| Actual and commitment | Invoice, payroll allocation, purchase order, usage, accrual | Committed cost exceeds annual plan |
| Operational driver | Accepted output, calls, tokens, storage, reviews, releases | Cost per accepted output crosses threshold |
| Estimate at completion | Actual to date plus remaining forecast and exit | PV TCO approaches the alternative's switching margin |
| Decision log | Assumption changed, evidence, approver, date, consequence | Service level or control requirement changes |
The FinOps Forecasting capability describes forecasting as a way to understand future spending and evaluate scenarios, including lifecycle changes and TCO. Use rolling forecasts to update the decision while preserving the original baseline; overwriting the baseline removes the evidence needed to learn from variance.
Use TCO as the complete cost side of an ROI calculation
A TCO model describes resource consumption; an ROI model compares incremental value with incremental cost. To avoid mixing decision frames, first select a baseline, then calculate the incremental cost of the proposed option relative to that baseline. Enter benefits separately and preserve their timing. Do not enter the full cost of both options as “investment.”
| TCO evidence | Calculator treatment | Do not do this |
|---|---|---|
| Year-zero implementation, migration, training, and parallel run | Enter as initial incremental investment or time-phased cost | Hide transition inside annual subscription |
| Recurring proposed-option cost | Enter incremental operating cost by period | Count gross platform cost without removing avoidable baseline cost |
| Avoided baseline cost | Treat as a benefit only when the cost will actually be avoided | Call capacity release a cash saving |
| Exit cost and residual value | Place in the period expected, with opposite signs where appropriate | Omit terminal effects because they occur after launch |
| Risk and uncertainty | Use expected cost, scenarios, or sensitivity without duplication | Subtract an unverified “risk benefit” from cost |
For the worked comparison, the Buy option is $1.293 million lower in present-value cost than Continue. That cost difference can support the investment case only if the two options deliver equivalent service. Any change in revenue, quality, capacity, risk, or strategic flexibility belongs on the benefit or outcome side, supported by separate evidence.
Test your lifecycle assumptions in the ROI Calculator
Transfer the incremental implementation cost, recurring cost, avoided baseline cost, benefits, timing, and discount assumptions from your TCO evidence. Keep the underlying cost schedule for review.
Open the ROI Calculator Use approved, sanitized planning inputs. Do not paste credentials, personal data, confidential contract terms, or sensitive operational records.Build a review-ready total cost of ownership model in twelve steps
- State the decision. Name the owner, decision date, alternatives, required outcome, constraints, and approval criteria.
- Set one comparison boundary. Define organizations, functions, environments, geographies, users, data, and shared services included or excluded.
- Define equivalent service. Specify accepted output, volume, quality, latency, availability, security, privacy, audit, and support.
- Choose the lifecycle and price basis. Record the base date, horizon, currency, nominal or constant treatment, timing convention, and approved discount rate.
- Create a common work breakdown. Use the same acquisition, implementation, operation, governance, maintenance, and exit rows for every option, including explicit zeros.
- Estimate workload. Connect business demand to accepted output, calls, retries, consumption, storage, support, review, and evaluation.
- Collect traceable evidence. Use actuals, contracts, telemetry, work plans, control requirements, and documented expert judgment with dates and owners.
- Time-phase every cost. Place transition, recurring, change, and exit cost in the period expected instead of annualizing everything by default.
- Reconcile price, internal work, and shared cost. Bridge quotes to TCO, add causal shared-service demand, and remove irrelevant common overhead.
- Calculate nominal and present-value TCO. Show annual schedules, discount factors, totals, equivalent annual cost, and cost per comparable accepted output.
- Test uncertainty and feasibility. Run sensitivity, break-even, and coherent scenarios; keep non-negotiable requirements as gates rather than monetary offsets.
- Approve, baseline, and monitor. Record the decision and conditions, then compare actuals and forecast-to-complete against the baseline using operational drivers.
The U.S. Government Accountability Office's Cost Estimating and Assessment Guide is a detailed public reference for developing reliable lifecycle cost estimates, documenting assumptions and exclusions, conducting sensitivity and risk analysis, and updating estimates with actual cost. Adapt the rigor to the size and consequence of your decision.
Review the model with evidence, arithmetic, and decision quality gates
| Gate | Pass condition | Failure signal |
|---|---|---|
| Comparability | All options satisfy the same documented service or differences are valued separately | One option assumes lower quality, security, or volume without disclosure |
| Completeness | Every lifecycle category appears for every option, including zero and exclusion rationale | Buy is a quote, Build is payroll, and Continue is blank |
| Traceability | Material rows have quantity, rate, source, date, owner, and confidence | Totals are typed manually or linked to unnamed assumptions |
| Arithmetic | Subtotals reconcile; signs, periods, discount factors, and units are independently checked | Residual value raises cost or annual totals do not equal category totals |
| Uncertainty | Material drivers have ranges, scenarios, thresholds, and monitoring owners | A single point estimate is presented as a promise |
| Decision logic | Cost, value, feasibility, risk, and strategic constraints are clearly separated | Lowest TCO is declared best without testing outcomes |
Independent review should reproduce at least the major totals from source assumptions, not merely inspect formatting. The reviewer should challenge boundary choices, service equivalence, workload, internal labor, risk treatment, and terminal cost. Resolve comments through a decision log so the final number does not lose its reasoning history.
Avoid the errors that make a TCO comparison look precise but mislead
A cheaper option with lower accepted volume, weaker controls, or slower service is not automatically cost-effective. Normalize the service or value the difference.
A license or cloud quote excludes internal implementation, data, review, support, governance, change, and exit unless stated otherwise.
Continue has operating, remediation, risk, and eventual retirement cost. Leaving it blank biases the model against change.
AI demand may depend more on calls, context, retries, tools, storage, review, and accepted outputs than named users.
Existing staff time still has opportunity cost when the decision consumes scarce capacity. Use fully loaded rates consistently.
Do not put the same remediation in base cost, expected loss, contingency, and downside scenario. Map each uncertainty to one treatment.
Inflated cash flows require a consistent nominal rate; constant-price flows require a consistent real rate.
Contract termination, data export, migration, deletion, and decommissioning belong in ownership even when they occur after the visible project.
TCO has no benefit numerator. Use ROI or a cost-benefit analysis when outcomes differ.
For a narrower before-and-after view, use the cost savings calculator guide. For an implementation-centered case, see the business case template and automation ROI guide. These pages answer adjacent questions; they should share evidence without duplicating the decision logic.
Frequently asked questions about total cost of ownership
What is total cost of ownership?
Total cost of ownership is the complete cost of acquiring, implementing, operating, maintaining, governing, changing, and retiring a system over a defined lifecycle, net of approved residual value.
How do you calculate total cost of ownership?
Define the decision and lifecycle, build the same cost boundary for every option, time-phase each cost, subtract supported residual value, discount future amounts when appropriate, and test uncertainty. Keep nominal annual schedules beside present-value results.
What costs belong in AI software TCO?
Include acquisition, integration, data migration, infrastructure, licenses and usage, internal labor, human review, evaluation, governance, security, support, training, maintenance, expected risk, change, and exit within the defined boundary.
What is the difference between purchase price and TCO?
Purchase price is one visible commercial cost. TCO includes all internal and external resources required before, during, and after use, including implementation, operation, controls, migration, maintenance, risk, and retirement.
What is the difference between TCO and ROI?
TCO measures lifecycle cost. ROI compares net benefit with cost. TCO can supply the cost side of an investment case, but it cannot determine whether an option is worthwhile without benefits, outcomes, timing, and risk.
How should build-versus-buy TCO be compared?
Compare options that meet the same requirements using the same horizon, price basis, cost taxonomy, workload, internal labor treatment, risk method, discount rate, residual value, and exit assumptions. Value material differences separately.
Primary references for lifecycle cost, AI risk, and forecasting
- U.S. GAO Cost Estimating and Assessment Guide — lifecycle cost, work breakdown, basis of estimate, sensitivity, risk, documentation, and updates with actual cost.
- FinOps Foundation: Cost Estimation of AI Workloads — AI cost drivers from development and pilot through production adoption.
- FinOps for AI Overview — operating context for AI value, cost, TCO, and ROI.
- NIST AI Risk Management Framework and AI RMF Playbook — voluntary risk-management structure and suggested actions.
- NIST Secure Software Development Framework 1.1 — secure development practices that can be translated into build and maintenance work packages.
This page is an educational planning example, not financial, accounting, procurement, legal, tax, security, or investment advice. The figures are hypothetical. Use approved organizational policies, current contracts, actual workload evidence, applicable regulation, and qualified reviewers for a real decision.