What does a complete ROI example look like?
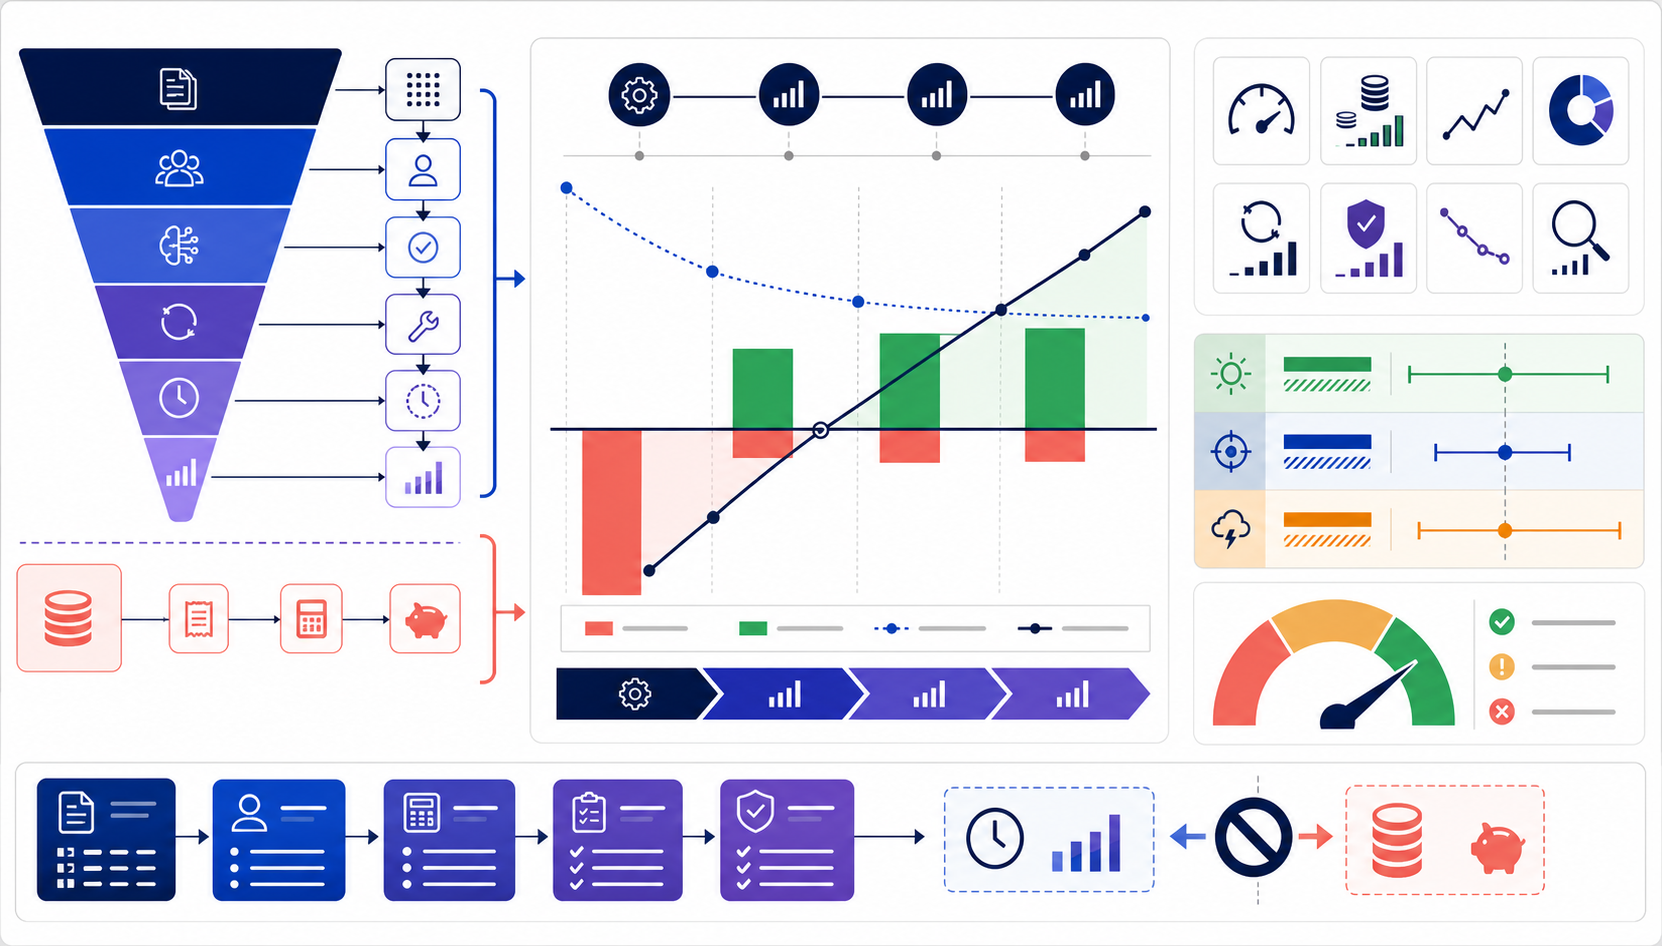
In this hypothetical AI data-analysis project, three-year undiscounted benefits are $720,000, total costs are $342,000, and net benefit is $378,000. The three-year simple ROI is 110.5%. At an illustrative 8% discount rate, present-value benefits are $614,858, present-value costs are $310,177, NPV is $304,681, benefit-cost ratio is 1.98, and discounted ROI is 98.2%. The initial investment is recovered after about 0.93 years under an even-cash-flow interpolation.
These outputs are not interchangeable. First-year ROI answers an early-period question, three-year simple ROI ignores timing, NPV expresses present-value dollars, and discounted ROI expresses present-value return relative to present-value cost. A defensible analysis names the metric, horizon, discount rate, baseline, attribution rule, and evidence behind every input.
Choose the return measure before calculating
| Measure | Formula | Decision question | Limitation |
|---|---|---|---|
| First-year simple ROI | (Year-one benefit − costs through year one) ÷ costs through year one | Has the investment created a positive return by the first year? | Excludes later value and ignores timing within the year. |
| Multi-year simple ROI | (Total benefits − total costs) ÷ total costs | How large is undiscounted return over the chosen horizon? | Treats near and distant cash flows as equal. |
| NPV | Present value of benefits − present value of costs | How much present-value wealth does the project add? | Depends on horizon, discount rate, and cash-flow timing. |
| Discounted ROI | (PV benefits − PV costs) ÷ PV costs | What is return relative to present-value cost? | Still needs the absolute scale supplied by NPV. |
| Benefit-cost ratio | PV benefits ÷ PV costs | How many present-value benefit dollars exist per cost dollar? | Can favor small projects; compare NPV too. |
| Payback | Time until cumulative net cash flow reaches zero | How long is capital exposed? | Ignores value after payback unless paired with other measures. |
State the exact version of ROI in the headline of any business case. “ROI is 110.5% over three years, undiscounted” is auditable. “ROI is 110.5%” is incomplete because a reader cannot tell which costs, benefits, or timing were used.
Define the decision, alternative, and business-as-usual baseline
The example evaluates whether to deploy an AI-assisted analysis workflow for a defined set of repeatable internal requests. The alternative is business as usual: analysts continue the current process with existing tools, review rules, staffing, and service levels. The three-year horizon starts at implementation, includes one setup period and three operating years, and excludes unrelated enterprise transformation.
Analytics operations leader, with finance and risk review.
Repeatable, reviewable requests with stable inputs and acceptance criteria.
High-stakes decisions, novel investigations, sensitive data without approved access, and tasks lacking a human reviewer.
Positive risk-adjusted value with quality, security, reliability, and adoption inside approved thresholds.
A baseline is a forecast of what would occur without the investment, not merely last year's spend. Adjust for committed hiring, known demand growth, contractual price changes, existing productivity trends, and mandatory controls. Otherwise the project receives credit for changes that would have happened anyway.
Convert recovered work into realized economic value
Do not begin with a percentage such as “AI saves 30%.” Begin with workflow events. Measure eligible requests, actual exposure, accepted outputs, human review, correction, exception handling, and whether released capacity was used for approved work. The benefit is the difference between the business-as-usual resource requirement and the complete post-change requirement for comparable accepted output.
Net recovered hours =
  baseline hours for comparable accepted work
  − post-change execution, review, rework, exception,
    monitoring, and support hours

Realized capacity value =
  net recovered hours × documented reuse rate
  × approved value per reused hour

Total benefit =
  realized capacity value + verified incremental cash savings
  + other non-overlapping attributable value
In year one, the team observes 2,800 net recovered hours after all review and rework. It documents that 75%—2,100 hours—was redirected to approved backlog and recurring decision support. Finance approves an $80 value per reused hour for this decision, producing $168,000 of realized capacity value. A separate $42,000 comes from terminated legacy licenses and reduced contractor invoices. These streams do not overlap, so year-one benefit is $210,000.
Include implementation, operation, assurance, and change costs
The denominator must contain every incremental resource required to create and sustain the claimed benefit. Licensing alone is not total cost. Include integration, data preparation, evaluation, security, privacy, training, process redesign, human review, monitoring, incident response, vendor management, support, and decommissioning where material. Exclude sunk costs that do not change with the decision, but document them.
| Cost category | Year 0 | Year 1 | Evidence |
|---|---|---|---|
| Implementation and integration | $70,000 | — | Approved work plan, vendor statement, internal labor |
| Training and process redesign | $30,000 | — | Attendance, fully loaded labor, change plan |
| Security, privacy, and evaluation setup | $20,000 | — | Control plan and reviewer labor |
| Platform, license, and usage | — | $44,000 | Contract and metered usage |
| Monitoring and support | — | $14,000 | Support roster and operating records |
| Ongoing evaluation and governance | — | $12,000 | Review schedule, testing, incident and control records |
| Total | $120,000 | $70,000 | Reconciled to finance owners |
Recurring cost increases to $74,000 in year two and $78,000 in year three because use volume and assurance activity rise. That increase is modeled explicitly rather than hidden behind a flat run-rate assumption.
Review the complete cash-flow table before applying formulas
| Period | Capacity value | Cash savings | Total benefit | Total cost | Net cash flow |
|---|---|---|---|---|---|
| Year 0 | — | — | $0 | $120,000 | −$120,000 |
| Year 1 | $168,000 | $42,000 | $210,000 | $70,000 | $140,000 |
| Year 2 | $197,000 | $48,000 | $245,000 | $74,000 | $171,000 |
| Year 3 | $213,000 | $52,000 | $265,000 | $78,000 | $187,000 |
| Total | $578,000 | $142,000 | $720,000 | $342,000 | $378,000 |
Year-two and year-three capacity value rises only after adoption, acceptance, and documented reuse increase; cash savings rise as separate contracts and contractor invoices change. The analyst should preserve the supporting schedules rather than treating the annual totals as unsupported growth. Cost and benefit must be recorded in the period when they occur.
Step 1: calculate the first-year ROI
By the end of year one, the decision has incurred the $120,000 implementation cost and $70,000 of year-one operating cost. It has produced $210,000 of year-one benefit. The numerator and denominator therefore use costs through the same cutoff date.
Costs through year one = $120,000 + $70,000 = $190,000
Net benefit through year one = $210,000 − $190,000 = $20,000

First-year ROI = $20,000 ÷ $190,000
               = 0.105263
               = 10.5%
A positive 10.5% first-year ROI does not prove that the rollout is safe, scalable, or superior to every alternative. It means only that the modeled benefit through the first year exceeds modeled cost through the first year by 10.5% of that cost. The result should be paired with actual quality, adoption, security, and reliability evidence.
Step 2: calculate three-year simple ROI
Simple ROI aggregates all undiscounted benefits and costs inside the chosen three-year horizon. This makes the calculation easy to communicate, but it treats a dollar received in year three as equal to a dollar received in year one.
Total benefits = $210,000 + $245,000 + $265,000
               = $720,000

Total costs = $120,000 + $70,000 + $74,000 + $78,000
            = $342,000

Net benefit = $720,000 − $342,000 = $378,000

Three-year simple ROI = $378,000 ÷ $342,000
                      = 1.105263
                      = 110.5%
Interpretation: over the modeled horizon, the project creates $1.105 of undiscounted net benefit for each dollar of undiscounted cost, in addition to returning the cost itself. Do not say it “returns 2.105%.” Total undiscounted benefit divided by total cost is 2.105, while net benefit divided by cost is the 110.5% ROI.
Step 3: convert future cash flows to present value
Discounting reflects time preference and the opportunity cost of resources. The example uses an illustrative annual discount rate of 8% and assumes each operating-year cash flow occurs at year end. Your organization should use its approved rate and timing convention. Public-sector analysts should follow the applicable jurisdictional guidance rather than copying this rate.
Present value in period t = cash flow in period t ÷ (1 + r)^t

where:
  r = annual discount rate
t = number of years after the decision date| Period | Discount factor at 8% | PV benefits | PV costs | PV net flow |
|---|---|---|---|---|
| Year 0 | 1.0000 | $0 | $120,000 | −$120,000 |
| Year 1 | 0.9259 | $194,444 | $64,815 | $129,630 |
| Year 2 | 0.8573 | $210,048 | $63,443 | $146,605 |
| Year 3 | 0.7938 | $210,366 | $61,919 | $148,447 |
| Total | — | $614,858 | $310,177 | $304,681 |
Displayed values are rounded to the nearest dollar, while the return metrics use unrounded calculations. If readers add rounded rows, they may see a one-dollar difference; retain full precision in the model and round only for presentation.
Step 4: calculate NPV, discounted ROI, and benefit-cost ratio
NPV = $614,858 − $310,177
    = $304,681

Discounted ROI = $304,681 ÷ $310,177
               = 98.2%

Benefit-cost ratio = $614,858 ÷ $310,177
                   = 1.98
A positive NPV means the modeled present value of benefits exceeds the modeled present value of costs at the selected discount rate. A 1.98 benefit-cost ratio means the model contains about $1.98 of present-value benefit for each $1.00 of present-value cost. Discounted ROI is 98.2%, lower than the 110.5% simple ROI because benefits arrive later than much of the cost.
Use the measures together. ROI supports relative return, NPV shows absolute value, benefit-cost ratio supports value-per-cost comparisons, and payback describes exposure duration. None replaces evidence about deliverability, risk, or distributional effects.
Step 5: calculate discounted payback without hiding the timing assumption
The year-zero balance is −$120,000. The discounted year-one net flow is about $129,630, so cumulative discounted value becomes positive during year one. If the year-one net flow is assumed to occur evenly through the year, the fractional payback is:
Discounted payback =
  unrecovered balance at start of year one
  ÷ discounted year-one net flow

= $120,000 ÷ $129,629.63
= 0.9257 years
≈ 0.93 years
The 0.93-year result is an interpolation, not an observed payment date. If benefits arrive only after an annual contract closes, or implementation cost is phased monthly, use monthly or quarterly cash flows instead. With year-end-only timing, the defensible statement is simply “payback occurs by the end of year one.”
Test downside, base, and upside scenarios
A single-point ROI hides uncertainty. The downside case reduces every benefit by 30% and increases every cost by 15%. The upside case increases benefits by 15% while leaving costs unchanged. These are transparent stress assumptions, not probabilities and not confidence intervals.
| Scenario | Benefit assumption | Cost assumption | NPV | BCR | Discounted ROI |
|---|---|---|---|---|---|
| Downside | −30% | +15% | $73,697 | 1.21 | 20.7% |
| Base | As modeled | As modeled | $304,681 | 1.98 | 98.2% |
| Upside | +15% | No change | $396,910 | 2.28 | 128.0% |
The project remains positive in the specified downside scenario, but that does not mean every risk has been covered. Create separate tests for slower adoption, lower acceptance, greater review effort, delayed rollout, higher usage charges, shorter asset life, data incidents, and inability to redeploy capacity. Correlated changes matter: low adoption may reduce both benefits and variable cost, while an incident may reduce benefit and increase remediation cost together.
Calculate how far benefits can fall before NPV reaches zero
A switching value solves for the assumption at which the decision changes. With costs held at their base present value, benefits reach the zero-NPV boundary when their present value equals present-value cost.
Break-even benefit factor =
  PV costs ÷ PV benefits

= $310,176.80 ÷ $614,858.00
= 0.5045

Allowable reduction before zero NPV =
  1 − 0.5045
= 49.6%
Interpretation: if all benefit streams moved proportionally and costs stayed fixed, realized benefits could be about 49.6% below the base estimate before discounted NPV reached zero. This is a threshold, not the probability that benefits will fall. Compare it with empirical uncertainty in adoption, acceptance, reuse, and unit value. A wide margin is useful only if the base evidence is credible.
Keep cash savings, avoidance, capacity, and outcomes separate
| Benefit class | Recognition rule | Evidence | Common error |
|---|---|---|---|
| Cash saving | Actual payroll, contractor, license, infrastructure, or other spend falls. | Invoice, contract, payroll, or budget ledger | Valuing time and calling it cash |
| Cost avoidance | A credible approved future cost no longer occurs because of the project. | Baseline forecast, approval, attribution | Using an aspirational hiring plan as fact |
| Capacity | Net hours become available and are demonstrably reused. | Workflow logs, reuse record, approved value | Counting gross time before review and rework |
| Outcome value | An attributable business outcome improves beyond baseline. | Outcome measure, counterfactual, unit value | Counting both labor capacity and the full output value without checking overlap |
A management dashboard may display all categories, but the financial model should include only effects with an approved valuation rule and non-overlapping boundary. Keep unmonetized outcomes visible beside ROI so strategically important quality, speed, access, or risk changes are not discarded merely because their unit value is uncertain.
Use a benefit register to prevent double counting
Double counting usually occurs across departments, time, or categories rather than inside one formula. Assign each benefit a unique identifier, mechanism, owner, source, baseline, calculation, period, confidence, and overlap check. A finance reviewer should be able to trace every total back to one record.
- Choose one primary claim per mechanism.If capacity avoids a contractor invoice, do not also value those same hours as additional output unless the split is evidenced.
- Reconcile organizational totals.A saving recorded by analytics and procurement must not appear twice in the enterprise case.
- Separate stock and flow.A one-time license termination is not a new saving every month beyond the recurring contract reduction already modeled.
- Use mutually exclusive scenarios.If two future operating models cannot occur together, compare them rather than summing them.
Integrate AI risk into cost, benefit, and approval gates
Risk is not handled by adding a vague discount to every benefit. First define the context, affected users, data, dependencies, failure modes, and controls. Then reflect risk through explicit remediation cost, expected loss where defensible, slower adoption, lower acceptance, additional review, delayed timing, or a decision gate. NIST's voluntary AI Risk Management Framework organizes this work through Govern, Map, Measure, and Manage functions and emphasizes continuous monitoring rather than one-time approval.
| Risk mechanism | Financial-model treatment | Operating evidence |
|---|---|---|
| Incorrect analysis | Review and correction cost; lower acceptance; expected incident loss if estimable | Test set, severity, escaped defects, reviewer overrides |
| Sensitive-data exposure | Control, monitoring, response, and residual-risk treatment | Access, retention, incident, vendor, and privacy controls |
| Model or workflow drift | Recurring evaluation cost and benefit degradation scenarios | Acceptance, correction, distribution, and usage trend |
| Vendor dependency | Price scenarios, migration cost, exit cost, availability risk | Contract terms, portability test, fallback procedure |
Some conditions should be non-financial stop rules. If approved access, human review, traceability, or required quality cannot be maintained, a positive modeled NPV does not authorize deployment.
Pair portfolio ROI with cost and value per accepted unit
Portfolio ROI can improve while individual workflows deteriorate if high-value growth hides waste. FinOps unit economics connects technology spend to a value-generating business or technical unit. For this project, useful units could include cost per accepted analysis request, cost per reviewed AI-assisted output, benefit per reused analyst hour, and platform cost per accepted output.
Cost per accepted output =
  fully loaded workflow cost ÷ accepted outputs

Benefit per exposed eligible request =
  attributable realized benefit ÷ exposed eligible requests

Reuse realization rate =
  documented reused hours ÷ net recovered hours
Segment these measures by task type, complexity, risk class, and user group. A single average can improve because easy work expands while complex work becomes slower. Preserve acceptance criteria so the unit does not become cheaper merely by lowering quality.
Make every model input traceable and reviewable
| Field | Required content | Why it matters |
|---|---|---|
| Input and version | Named variable, model version, reporting period | Prevents silent changes. |
| Definition and boundary | Inclusions, exclusions, task population, acceptance rule | Keeps comparisons equivalent. |
| Source and lineage | System, query, owner, extraction date, transformations | Allows reproduction and correction. |
| Calculation | Formula, unit, timing, discount convention, rounding | Makes outputs auditable. |
| Uncertainty | Range, confidence, scenario rule, known bias | Prevents point estimates from appearing certain. |
| Approval and review | Operational, finance, security, risk, and decision owners | Creates accountability. |
Freeze the approved model before implementation, then compare forecast with actuals using the same definitions. Record revisions instead of overwriting history. A lower realized ROI can still produce valuable learning if the organization can identify whether adoption, workflow fit, cost, quality, or the original baseline caused the gap.
Map the worked example into an ROI calculator
A calculator is useful when it makes assumptions visible and applies formulas consistently. It does not validate the evidence for you. Before entering data, create one approved source schedule and map each calculator field to a variable, unit, period, and owner.
| Calculator input | Value in this example | Validation question |
|---|---|---|
| Initial investment | $120,000 | Does it include implementation, training, controls, and internal labor? |
| Year-one benefit | $210,000 | Are capacity value and cash savings evidenced and non-overlapping? |
| Year-one recurring cost | $70,000 | Does it include usage, review, monitoring, support, and governance? |
| Later-year cash flows | Benefits $245,000 / $265,000; costs $74,000 / $78,000 | Are adoption, price, and volume changes supported? |
| Discount rate | 8% illustrative | Is it approved for this decision and cash-flow basis? |
| Horizon | Three operating years plus year-zero implementation | Does it reflect useful life, contract, and migration timing? |
Calculate your own ROI with visible assumptions
Enter your evidence-based benefits and full costs, review the output, then return to the source register and scenario tests before presenting a decision.
Open ROI CalculatorUse a nine-step ROI decision workflow
- Write the decision.Name the owner, alternative, deadline, population, required outcome, and stop conditions.
- Define business as usual.Forecast demand, cost, quality, capacity, and committed change without the project.
- Map the causal mechanism.Explain how the intervention changes work and how that change creates each benefit.
- Set acceptance and guardrails.Define quality, security, privacy, reliability, access, and human-review requirements before measurement.
- Collect comparable evidence.Use the same task mix, boundary, timing, and acceptance rule before and after the change.
- Classify effects.Separate cash, avoidance, capacity, outcomes, transfers, and unmonetized effects.
- Build cash flows.Assign benefits and full incremental costs to the periods when they occur.
- Calculate and stress-test.Show simple ROI, NPV, discounted ROI, BCR, payback, scenarios, and switching values.
- Approve, monitor, and revise.Assign owners, freeze the model version, compare actuals, investigate variance, and stop or adapt when thresholds fail.
Avoid these common ROI example errors
| Error | Why it misleads | Correction |
|---|---|---|
| Mixing horizons | Three-year benefit is compared with one-year cost. | Use the same cutoff in numerator and denominator. |
| Using gross time saved | Review, rework, support, and exceptions disappear from the model. | Measure net end-to-end time for accepted work. |
| Calling capacity cash | The income statement or budget may not change. | Separate capacity, prove reuse, and use an approved valuation. |
| Omitting recurring assurance | AI evaluation, human review, monitoring, and governance are real operating costs. | Include full incremental cost over the useful life. |
| Using one point estimate | Adoption, price, timing, and quality uncertainty remain invisible. | Show scenarios, switching values, and evidence strength. |
| Treating positive ROI as approval | Feasibility, risk, distribution, and constraints are ignored. | Use ROI as one input in a governed decision. |
Frequently asked questions about ROI examples
What is an ROI example?
An ROI example applies a defined benefit and cost boundary to real or hypothetical cash flows, shows each calculation, and explains how the result changes under different assumptions.
How do you calculate ROI step by step?
Define the decision and baseline, estimate attributable benefits, include implementation and recurring costs, calculate net benefit, divide net benefit by total cost, then test timing, discounting, uncertainty, and evidence quality.
What costs belong in an AI project ROI?
Include implementation, integration, data preparation, licenses and usage, infrastructure, training, change management, review, monitoring, evaluation, governance, security, support, and expected risk costs within the chosen boundary.
Are saved hours cash savings?
Not automatically. Saved hours are capacity unless payroll, contractor, overtime, or approved hiring spend actually changes. Capacity may be valued only when its reuse and approved unit value are documented.
What is the difference between simple and discounted ROI?
Simple ROI uses undiscounted totals. Discounted ROI converts future benefits and costs to present value before calculating return, so it reflects timing and the selected discount rate.
How do you calculate payback period?
Accumulate net cash flows until the initial investment is recovered. If cash flow is assumed to arrive evenly during a period, divide the unrecovered balance by that period's net cash flow to interpolate the fraction.
Methods and primary sources
The hypothetical figures and calculations are original to this worked example. The following primary guidance supports the appraisal, discounting, sensitivity, unit-economics, and AI-risk methods. Apply the rules and rates required by your own organization and jurisdiction.
- U.S. Office of Management and Budget, Circular A-94: Guidelines and Discount Rates for Benefit-Cost Analysis of Federal Programs
- HM Treasury, The Green Book 2026: appraisal and evaluation in central government
- U.S. National Institute of Standards and Technology, AI Risk Management Framework
- FinOps Foundation, Unit Economics capability
Method note: benefits and recurring costs are assumed to occur at each year end; year-zero implementation cost occurs immediately; the 8% discount rate is illustrative; displayed dollar values are rounded; payback interpolation assumes year-one discounted net flow is distributed evenly. No result is a promise of product performance or investment return.