
How does a productivity calculator work?
What a Productivity Calculator measures
A useful Productivity Calculator compares accepted output with the labor time required to produce it, using the same scope and quality standard before and after a change. For a data team, calculate annual task volume, baseline minutes per task, assisted minutes, adoption, and rework. The result is verified hours recovered and potential additional capacity—not automatic cash savings.
Separate speed from other productivity mechanisms
The simplest calculation is output divided by labor hours. A planning model becomes more useful when it also explains why productivity changes: faster task execution, fewer corrections, higher reuse, a different task mix, or fewer handoffs. Keep these mechanisms separate so a favorable result can be tested rather than merely presented.
Define output before measuring speed
Official labor-productivity framing
The International Labour Organization describes labor productivity as output per unit of labor input, such as people engaged or hours worked; Eurostat similarly frames it as real output divided by labor input. In a data workflow, “output” must be operationally defined: an accepted query, a validated analysis, a published dashboard update, a resolved data request, or another unit a consumer can use. Counting drafts or generated answers overstates productivity when they still require correction.
Write one acceptance rule first
Write one acceptance rule before collecting time. For example: “one completed unit is a query that runs against the approved schema, answers the documented business question, passes peer review, and requires no correction within seven days.” The rule should be strict enough to protect quality and simple enough for reviewers to apply consistently. Without that rule, the model only reports activity, not accepted work.
Collect seven inputs the model can defend
The seven defendable Productivity Calculator inputs
| Input | Definition | Preferred evidence |
|---|---|---|
| Tasks per week | Accepted units within the measured scope | Ticket, query, or workflow logs |
| Working weeks | Active weeks after holidays and planned downtime | Operating calendar |
| Baseline minutes | Median end-to-end labor time per accepted unit | Time study or event timestamps |
| Assisted minutes | Equivalent time when the new workflow is used | Controlled pilot |
| Adoption rate | Eligible tasks actually using the workflow | Usage telemetry joined to task records |
| Rework rate | Assisted tasks requiring correction | Review outcomes and reopened work |
| Minutes per rework | Additional labor for each correction | Correction timestamps or sample review |
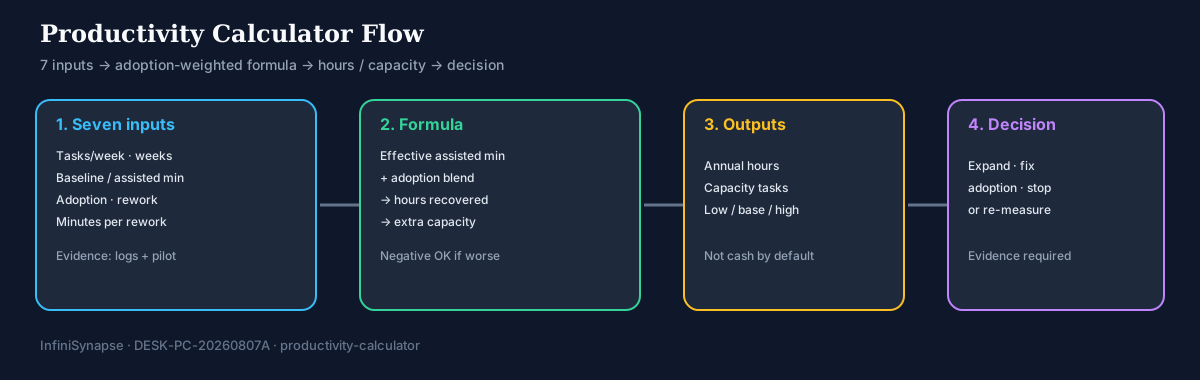
Segment workload before you average
Defendable measurement starts here—segment these inputs when workload differs materially. A routine filter change and an ambiguous executive analysis should not share one average. At minimum, separate simple, standard, and complex work or group by workflow family. Weighted results are only meaningful when category volumes and definitions remain stable.
Calculate adoption-weighted time and realized hours
Estimate effective assisted minutes
Treat rework as additional labor, not a percentage discount applied without context. First estimate the effective assisted minutes. Then blend assisted and baseline time using observed adoption. This prevents the model from applying a best-case pilot result to every task.
Annual tasks = tasks per week × working weeks

Effective assisted minutes =
  assisted minutes + (rework rate × minutes per rework)

Adoption-weighted minutes =
  (adoption rate × effective assisted minutes)
  + ((1 − adoption rate) × baseline minutes)

Annual hours recovered =
  annual tasks × (baseline minutes − weighted minutes) ÷ 60

Potential extra capacity =
  annual hours recovered × 60 ÷ effective assisted minutes
Keep negative results visible
If weighted minutes exceed the baseline, the result should be negative. Do not force it to zero. A negative result can reveal onboarding cost, poor task fit, low-quality output, or a measurement window that is too early. Keep training and setup hours separate so stakeholders can distinguish transitional investment from steady-state operation.
Work through a desk-verified data-team example
Desk composite inputs for the Productivity Calculator
Desk composite (InfiniSynapse first-party, Q1–Q2 2026): anonymized analytics enablement pilot—n=1 team, 8-week observation window, ticket + usage logs joined to review outcomes. Inputs used in the Productivity Calculator: 240 accepted analysis tasks per week for 48 working weeks; baseline median 42 minutes per task; assisted median 24 minutes; 70% eligible-task adoption; 20% of assisted tasks needed correction; each correction added 12 minutes. These are field-measured planning inputs for that pilot—not a named-customer case study and not a guarantee of results.
| Step | Calculation | Result |
|---|---|---|
| Annual tasks | 240 × 48 | 11,520 |
| Effective assisted time | 24 + (20% × 12) | 26.4 minutes |
| Weighted time | (70% × 26.4) + (30% × 42) | 31.08 minutes |
| Time recovered | 11,520 × (42 − 31.08) ÷ 60 | 2,096.64 hours |
| Capacity equivalent | 2,096.64 × 60 ÷ 26.4 | 4,765 additional assisted tasks |
State planning constraints beside the number
These are planning outputs, not a promise. The extra-task estimate assumes the recovered time is available, demand exists, the work mix remains comparable, and downstream review capacity can absorb more output. State those constraints beside the number. If the organization redeploys only half the recovered hours, use 50% utilization in the business case.
Measure an end-to-end baseline instead of guessing
Include preparation, validation, and delivery
Baseline time should include the labor required to understand the request, locate data, write or revise the query, validate results, document assumptions, and deliver the accepted output. Excluding validation makes the old process look slower only if validation is included after the change, or makes the new process look faster when hidden review labor moves to another person.
Use medians, percentiles, and audit rules
Use medians and distributions, not only averages. Report the 25th, 50th, and 75th percentiles for each work category. Remove an observation only under a documented rule, such as a system outage unrelated to the workflow. Preserve the original sample and exclusion reason so the baseline can be audited. The model is only as credible as that baseline trail.
Model actual usage and correction cost
Measure eligible-task adoption, not seats
Adoption is the share of eligible tasks that actually use the new workflow, not the share of employees who have an account. Join usage events to task records and define eligibility. Some tasks may be excluded because of unsupported data sources, security restrictions, or complexity. Report eligible-task coverage separately from adoption among eligible tasks.
Track rework rate and correction severity
Rework also needs a denominator and severity. A spelling correction and a logically wrong business result should not count as equal incidents. Track the percentage of assisted outputs requiring correction, minutes per correction, and defect severity. If assistance changes who performs validation, measure total labor across all roles before you trust the recovered hours.
Do not convert every recovered hour into cash
Capacity value versus cash savings
The team can complete more accepted work, shorten queues, improve review, or redirect effort. No payroll cost has necessarily disappeared.
A budgeted cost is avoided or reduced—for example, overtime, contractor spend, an external service, or planned hiring. The change must be evidenced.
Document the conversion rule
For ROI planning, value redeployed capacity only through an approved conversion rule. One option is avoided backlog cost; another is incremental accepted work multiplied by a defensible contribution value. Apply a utilization factor because meetings, dependencies, demand limits, and skill matching prevent perfect conversion. Keep the raw recovered hours visible beside any monetary estimate.
Protect quality while measuring faster work
Pair time with acceptance and rework
A workflow is not more productive if it generates more output that users reject. Pair time metrics with accepted-output rate, correction rate, unresolved defects, review findings, and consumer satisfaction. For high-risk analysis, add tests for data lineage, access control, reproducibility, and approval compliance. Set stop conditions before the pilot.
Keep quality standards stable across periods
Keep definitions stable across comparison periods. If the new process introduces stricter review, report that change and consider a parallel reassessment of the old sample. Otherwise, the model may attribute better measured quality—or slower measured speed—to the workflow when it actually reflects a different standard.
Use low, base, and high cases without hiding assumptions
Fix volume; vary uncertain adoption and rework inputs
Scenario analysis is more honest than one precise forecast. Keep task volume and working weeks fixed when testing the workflow mechanism, then vary uncertain inputs such as adoption, assisted time, rework, and capacity utilization. Use observed pilot ranges when available; do not choose optimistic values solely to reach a hurdle rate.
| Scenario | Adoption | Rework assumption | Interpretation |
|---|---|---|---|
| Low | Lower observed quartile | Higher correction load | Adoption friction persists |
| Base | Pilot median | Measured median | Most defensible planning case |
| High | Achieved by mature users | Lower, but observed | Requires stated enablement |
Read which assumption drives the decision
Show which Productivity Calculator input changes the result most. If the business case depends almost entirely on full adoption, the next action is an adoption experiment, not a larger spreadsheet. If rework dominates, improve evaluation and workflow fit before scaling.
How this productivity calculator relates to Lean and Six Sigma
Complement Lean and Six Sigma, do not replace them
Industry programs such as Lean (value vs waste; see Lean Enterprise Institute) and Six Sigma (ASQ overview of DMAIC variation reduction) optimize process flow and defect rates. A Productivity Calculator for knowledge work complements them: it does not replace takt or control charts. It quantifies adoption-weighted labor minutes and accepted-output capacity when the “product” is an analysis unit rather than a physical part.
Anchor in ILO, Eurostat, and AI risk controls
Use Lean thinking to remove non-value handoffs before you measure; use Six Sigma-style stratification so simple and complex tasks are not averaged together. Pair both with the NIST AI Risk Management Framework when assisted workflows involve AI agents that touch live data. Official labor-productivity definitions remain anchored in ILO and Eurostat output-per-labor-input framing—this calculator operationalizes that framing for analytics tickets.
Run a repeatable seven-step productivity calculator study
Seven-step Productivity Calculator method
- Define one accepted output unit. Specify scope, quality, owners, and exclusions before looking at speed.
- Select comparable work. Stratify by complexity and prevent task-mix changes from masquerading as improvement.
- Measure the baseline. Capture end-to-end labor time, acceptance, rework, and queue delay.
- Run a controlled pilot. Use representative users and tasks, with the same acceptance standard.
- Calculate realized change. Weight by adoption and include correction labor across all roles.
- Test uncertainty. Create observed low, base, and high scenarios and identify sensitive inputs.
- Verify after rollout. Compare forecast with actual adoption, quality, hours redeployed, and downstream constraints.
Why the study must be repeatable
Repeat the same seven steps after enablement changes so finance and platform leads can compare forecast versus realized capacity under one method.
Translate calculator outputs into decisions
Choose expand, fix, or stop
A strong result does not automatically justify organization-wide rollout. Check whether savings are concentrated in one task type, whether expert users drove the pilot, whether review teams become the bottleneck, and whether recovered capacity has a planned use. Define the next decision: expand to another workflow, improve adoption, revise controls, or stop.
Publish a reproducible evidence pack
Report a range with evidence, not a single impressive percentage. Include the baseline period, sample sizes, task categories, acceptance rule, adoption, rework, excluded observations, uncertainty, and calculation version. A decision-maker should be able to reproduce the result or identify which assumption they disagree with.
Avoid six productivity-calculation mistakes
Output counting and task-mix errors
Measure accepted work after validation, not drafts or model responses.
Separate simple and complex work so easier demand does not appear as improvement.
Weight by observed eligible-task usage and state excluded workflows.
Review labor, cash pricing, and one-case optimism
Include correction and validation time even when another role performs it.
Use a documented utilization and value rule; keep hours visible.
Show observed uncertainty and identify the assumptions that drive the decision.
Check whether the estimate is ready for an ROI case
Gate criteria before you convert hours
- The output unit and acceptance rule are written and consistently applied.
- Baseline and pilot tasks have comparable scope and complexity.
- Time includes preparation, validation, correction, and delivery labor.
- Adoption is measured at the eligible-task level.
- Rework rate, severity, and correction minutes are visible.
- Recovered hours are separated from cash savings and headcount claims.
- Capacity utilization has an approved use and conservative factor.
- Low, base, and high cases use observed or explainable ranges.
- Data owners can reproduce the result from source evidence.
- Post-rollout monitoring will compare forecast and realized value.
Use the checklist with verified capacity outputs
Only after these gates pass should planning teams feed Productivity Calculator hours into an ROI model.
Turn verified productivity inputs into an ROI case
Prepare verified workload inputs
Commercial CTA (InfiniSynapse product): Prepare annual workload, baseline and improved task time, adoption, rework, labor value, implementation cost, and utilization assumptions. Then use the InfiniSynapse Data Analysis ROI Calculator to model benefits, costs, payback, and sensitivity without treating every recovered hour as guaranteed cash.
Open the ROI calculator with labeled commercial intent
Open Data Analysis ROI Calculator Use aggregated, non-sensitive inputs. Validate assumptions with finance and workflow owners.Productivity calculator FAQ
Method questions for capacity measurement
Define a stable accepted-output unit, divide completed accepted units by labor hours, and compare periods with the same scope and quality standard.
Multiply annual task volume by baseline minutes minus adoption-weighted future minutes, then divide by 60 and include measured correction time.
Blend assisted and baseline times by measured eligible-task usage instead of assuming every task uses the new workflow.
Interpretation questions for calculator outputs
No. They are capacity unless a budgeted cost is demonstrably avoided or reduced under an approved conversion rule.
Measure acceptance, quality, rework, cycle time, task mix, adoption, and whether recovered capacity is actually reused.
Official productivity references
Primary labor-productivity sources
- International Labour Organization: Labour productivity FAQ
- Eurostat: Labour and capital productivity metadata
Process and AI-risk references
Use this Productivity Calculator when briefing finance and platform leads on capacity—not cash—claims.