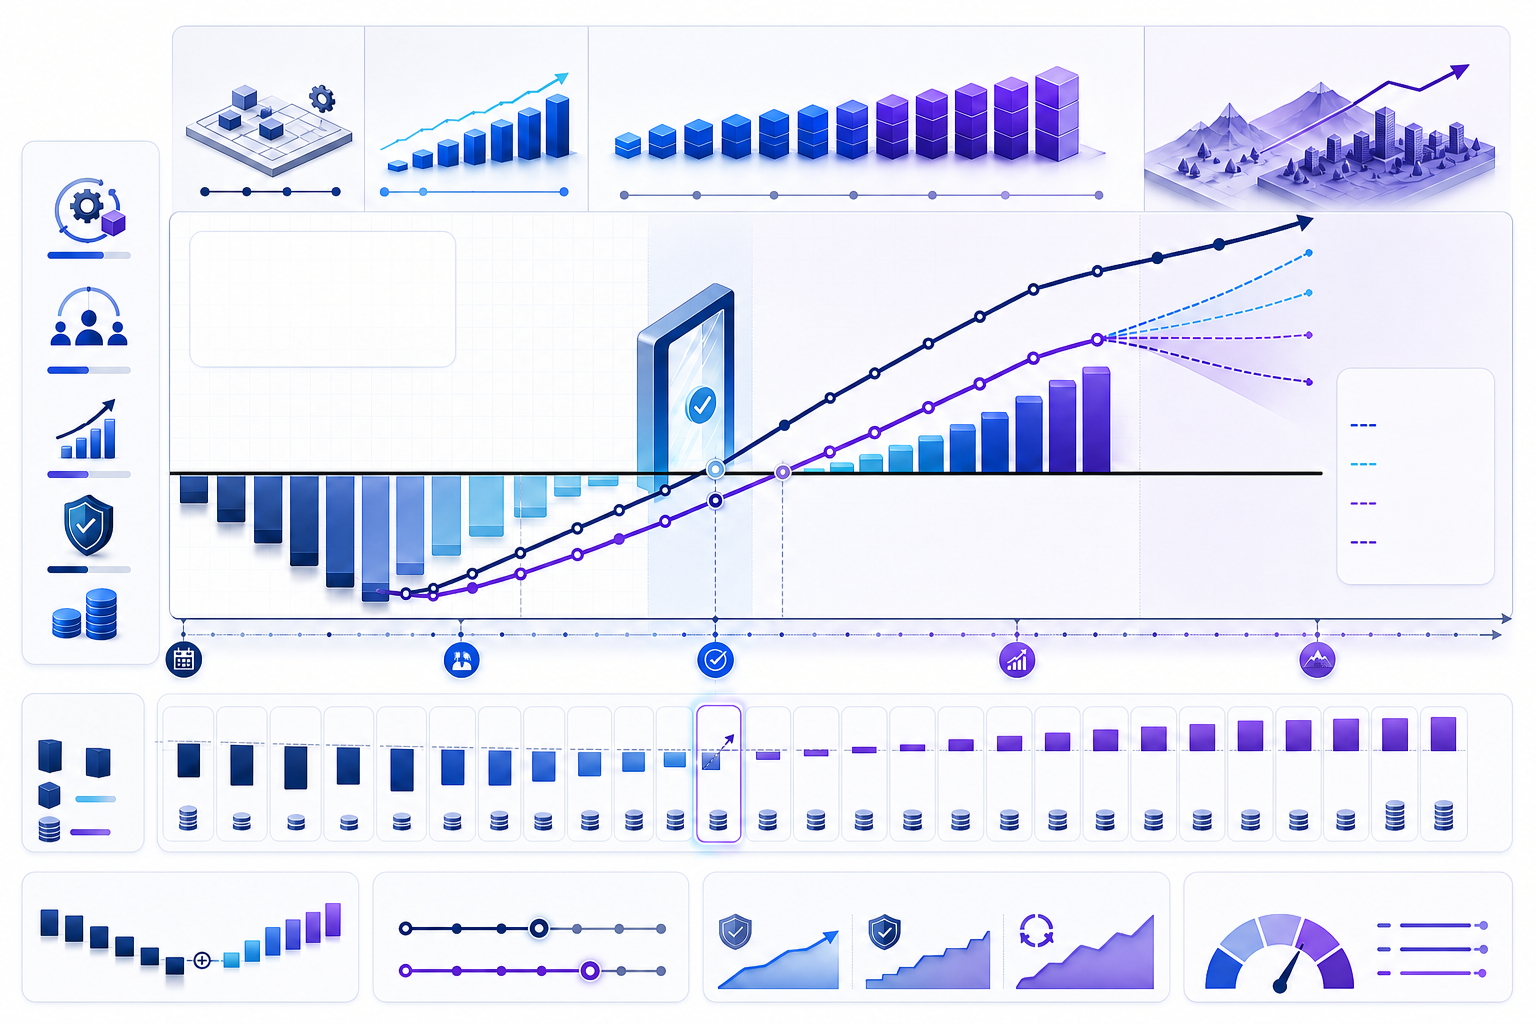
What is the payback period?
The payback period is the earliest time when cumulative net cash flow from an investment becomes zero or positive, meaning the included investment has been recovered. In the hypothetical 36-month AI data-workflow example on this page, cumulative undiscounted cash flow crosses zero during month 14. Interpolation gives a simple payback of 13.28 months. After discounting monthly cash flow at an illustrative 10% effective annual rate, discounted payback is 13.88 months.
Payback is a liquidity and exposure measure, not a complete value measure. It answers “how long is capital unrecovered?” but ignores cash flow after the crossing date. A shorter payback does not automatically mean higher net present value, stronger ROI, lower total cost, better strategic fit, or acceptable risk.
Choose the payback formula that matches the cash-flow pattern
The familiar shortcut—initial investment divided by constant annual net cash inflow—works only when the post-investment net inflow is stable, begins immediately, and there are no material later investments. AI projects commonly violate all three conditions because implementation continues, adoption ramps, usage and review costs recur, and benefits arrive unevenly.
Constant-flow simple payback =
  initial investment ÷ constant net cash inflow per period

Uneven-flow payback =
  full periods before cumulative net cash flow crosses zero
  + unrecovered balance before crossing
    ÷ net cash flow in the crossing period

Discounted net cash flow at period t =
  net cash flow at t ÷ (1 + annual discount rate)^(t ÷ periods per year)

Discounted payback =
first time cumulative discounted net cash flow reaches zero| Method | Cash flow used | Appropriate use | Main limitation |
|---|---|---|---|
| Constant-flow shortcut | One stable net inflow | Rough screening after steady state | Wrong when transition, ramp, or recurring cost varies |
| Cumulative simple payback | Actual undiscounted net flow by period | Liquidity and nominal recovery timing | Ignores time value and post-payback cash flow |
| Discounted payback | Present value of each period's net flow | Recovery after recognizing the approved discount rate | Still ignores value after payback |
| Exact-date cumulative PV | Dated cash flows discounted by elapsed days | Irregular invoices, savings, and contract events | Requires reliable dates and explicit accrual assumptions |
Net cash flow means cash benefits minus all incremental cash costs in the same period. Include subscription, consumption, support, human review, maintenance, retraining, and change when they continue after launch. Keep noncash capacity value separate unless there is an approved, evidenced route by which it changes cash or creates attributable value.
Define what “recovered” means before calculating a date
A payback date is only as meaningful as its cash-flow boundary. Name the decision, baseline, proposed option, analysis horizon, currency, price basis, tax treatment, financing treatment, discount rate, period length, and timing convention. State whether the model uses project cash flow, budget cash flow, or a broader economic value flow; do not blend them.
Acquisition, implementation, integration, data migration, security setup, training, internal project labor, and transition disruption that occur because of the decision.
Avoided contracts, overtime, approved hiring, incidents, rework, or other budget effects that actually change cash relative to the baseline.
Licenses, usage, cloud, data, support, human review, evaluation, governance, maintenance, retraining, and vendor management.
Capacity, quality, speed, resilience, risk, learning, and strategic flexibility reported separately unless an evidenced monetization route exists.
Use incremental cash flow: proposed-option cash flow minus business-as-usual cash flow. If a current contract continues under both options, it is not an incremental benefit. If the project frees employee hours but payroll does not change, those hours are not automatically cash inflow. If released capacity supports measurable additional output, show that as a separately governed value case.
Build a monthly AI project cash-flow schedule before calculating payback
The hypothetical project deploys an AI-assisted data workflow. Month zero contains $240,000 of acquisition and implementation. Integration, migration, security, and training add $55,000, $35,000, and $15,000 in months one through three. Benefits begin in month four and ramp as eligible work, user adoption, and first-pass acceptance improve. Stable monthly gross cash benefit is $64,000; stable recurring cash cost is $18,000; stable net inflow is therefore $46,000.
| Month | Incremental cash benefit | Incremental cash cost | Net cash flow | Cumulative simple cash flow |
|---|---|---|---|---|
| 0 | $0 | $240,000 | −$240,000 | −$240,000 |
| 1 | $0 | $55,000 | −$55,000 | −$295,000 |
| 2 | $0 | $35,000 | −$35,000 | −$330,000 |
| 3 | $0 | $15,000 | −$15,000 | −$345,000 |
| 4 | $20,000 | $18,000 | $2,000 | −$343,000 |
| 5 | $28,000 | $18,000 | $10,000 | −$333,000 |
| 6 | $38,000 | $18,000 | $20,000 | −$313,000 |
| 7 | $48,000 | $18,000 | $30,000 | −$283,000 |
| 8 | $58,000 | $18,000 | $40,000 | −$243,000 |
| 9 | $64,000 | $18,000 | $46,000 | −$197,000 |
| 10 | $64,000 | $18,000 | $46,000 | −$151,000 |
| 11 | $64,000 | $18,000 | $46,000 | −$105,000 |
| 12 | $64,000 | $18,000 | $46,000 | −$59,000 |
| 13 | $64,000 | $18,000 | $46,000 | −$13,000 |
| 14 | $64,000 | $18,000 | $46,000 | $33,000 |
The schedule makes three facts visible. Total transition outflow is $345,000, not only the $240,000 month-zero amount. Gross benefit must be reduced by recurring operation before accumulation. Payback occurs during month 14, not when the project first produces a positive monthly flow in month four.
Calculate simple payback from cumulative monthly cash flow
At the end of month 13, the project still has $13,000 unrecovered. Month 14 contributes $46,000 of net cash inflow. If that inflow accrues approximately evenly during the month, divide the unrecovered balance by the crossing-month flow to estimate the fraction of month required.
Simple payback =
  13 full months
  + $13,000 unrecovered ÷ $46,000 month-14 net inflow

= 13 + 0.2826087
= 13.28 months

Approximate month-in-period =
  0.2826087 × 30.44 average days
  ≈ 8.6 days into month 14
The 13.28-month result is not valid if the $46,000 arrives as one discrete payment at month-end. In that case the investment remains unrecovered until the payment date, so the defensible answer is “payback occurs at the end of month 14.” Use interpolation only when the underlying cash benefit genuinely accrues through the period or when the estimate is explicitly described as an approximation.
The constant-flow shortcut would also be misleading here. Dividing the $240,000 month-zero investment by the $46,000 stable monthly inflow produces 5.22 months, while dividing the full $345,000 transition outflow by $46,000 produces 7.50 months. Both omit the three-month implementation sequence and the five-month adoption ramp. The cumulative schedule correctly returns 13.28 months.
Calculate discounted payback with a consistent monthly convention
Discounted payback converts each monthly net cash flow to present value before accumulation. The example uses a hypothetical 10% effective annual rate. The equivalent effective monthly rate is approximately 0.7974%, calculated as (1.10)1/12 − 1. Applying the annual rate with an exponent of month divided by 12 produces the same factors.
| Month | Net cash flow | PV factor at 10% | Discounted net flow | Cumulative discounted flow |
|---|---|---|---|---|
| 0 | −$240,000 | 1.000000 | −$240,000 | −$240,000 |
| 1 | −$55,000 | 0.992089 | −$54,565 | −$294,565 |
| 2 | −$35,000 | 0.984240 | −$34,448 | −$329,013 |
| 3 | −$15,000 | 0.976454 | −$14,647 | −$343,660 |
| 4 | $2,000 | 0.968729 | $1,937 | −$341,723 |
| 5 | $10,000 | 0.961066 | $9,611 | −$332,112 |
| 6 | $20,000 | 0.953463 | $19,069 | −$313,043 |
| 7 | $30,000 | 0.945920 | $28,378 | −$284,665 |
| 8 | $40,000 | 0.938436 | $37,537 | −$247,128 |
| 9 | $46,000 | 0.931012 | $42,827 | −$204,301 |
| 10 | $46,000 | 0.923647 | $42,488 | −$161,813 |
| 11 | $46,000 | 0.916340 | $42,152 | −$119,662 |
| 12 | $46,000 | 0.909091 | $41,818 | −$77,844 |
| 13 | $46,000 | 0.901899 | $41,487 | −$36,356 |
| 14 | $46,000 | 0.894764 | $41,159 | $4,803 |
Discounted payback =
  13 full months
  + $36,356 unrecovered PV ÷ $41,159 month-14 PV flow

= 13 + 0.8833
= 13.88 months
The 0.60-month gap between simple and discounted payback is specific to this cash-flow shape and rate. It is not a universal adjustment. A higher rate, slower inflow, later benefits, or larger future costs will generally widen the gap. With a zero rate, discounted payback equals simple payback.
Do not mix effective, nominal, real, and monthly rates
A rate label must identify both economic meaning and compounding convention. “10%” is incomplete unless the reader knows whether it is an effective annual rate, a nominal annual rate compounded monthly, a real rate applied to constant-price cash flows, or a nominal rate applied to inflated cash flows.
| Convention | Monthly treatment | Use with | Control |
|---|---|---|---|
| Effective annual rate | (1 + r)1/12 − 1 | Cash flow under the same price basis | Use exponent t/12 or the equivalent monthly rate |
| Nominal annual rate, monthly compounding | rnominal ÷ 12 | The convention for which the rate was quoted | Do not call it an effective annual rate |
| Real discount rate | Convert consistently | Constant-price cash flow excluding general inflation | Keep specific real price changes explicit |
| Nominal discount rate | Convert consistently | Nominal cash flow including expected inflation | Do not add inflation twice |
The HM Treasury Green Book explains that discounting and inflation adjustment are distinct and that real discount rates should be applied to real values. A company, government body, or investor may use a different approved rate; the control is internal consistency, not copying the illustrative rate on this page.
Match the reported precision to how cash actually arrives
Interpolation assumes the crossing-period net flow is spread evenly. That may be reasonable for continuously avoided labor or transaction cost measured across many events. It is not reasonable for a renewal avoided on one date, a milestone payment, a grant receipt, a year-end rebate, or a benefit dependent on one customer contract.
Report an interpolated fraction when event volume is sufficiently smooth and evidence supports an even-period approximation.
Report the actual cash-flow date that turns the cumulative balance nonnegative; do not pretend recovery occurred earlier.
Report a range or “during period 14” and document the timing uncertainty instead of publishing false precision.
Split continuous and dated items. Accrue the first group and place the second on its evidence date.
NIST Handbook 135 notes that interpolation can produce a non-integer payback result but the underlying data often do not support that precision. The responsible report includes the period, method, timing assumption, and uncertainty—not only a decimal such as 13.28.
Use dated cash flows when invoices and benefits are irregular
Monthly buckets are adequate when timing within a month is immaterial. For irregular dates, discount each cash flow using the elapsed fraction of a year from a common valuation date. Build a running cumulative present value in chronological order. The payback date is the first date on which that running total is nonnegative.
PV of dated cash flow i =
  cash flow i
  ÷ (1 + annual rate)^((date i − valuation date) ÷ day-count basis)

Running cumulative PV at date k =
  Σ PV of all cash flows dated on or before k
Excel's XNPV function documentation describes present value for a cash-flow schedule that is not necessarily periodic and uses corresponding payment dates. XNPV returns NPV for the selected series; it does not directly return a payback date. To find discounted payback, calculate running XNPV or equivalent cumulative PV after each dated cash flow and identify the first nonnegative result.
Choose and disclose the day-count basis used by the model. The Microsoft function uses a 365-day year. If finance uses another approved convention, reproduce it consistently rather than combining spreadsheet defaults with a different contract or treasury basis.
Use cash flow for cash payback and report capacity separately
AI business cases often start with hours saved. Hours are an operational effect, not automatically cash. Payroll remains a cash outflow unless headcount, overtime, contractors, approved hiring, or another budget line changes. Counting every saved hour as cash inflow can pull payback forward without creating the liquidity that the metric is supposed to measure.
| Effect | Cash-payback treatment | Evidence needed | Separate outcome |
|---|---|---|---|
| Contractor hours eliminated | Include when invoice or commitment falls | Contract change, invoice, purchase order | Service and quality maintained |
| Overtime avoided | Include the observed incremental cash reduction | Payroll and comparable demand | Fatigue and resilience effects |
| Approved hire avoided | Include only the timing and amount actually removed | Approved requisition and revised workforce plan | Capacity delivered by the project |
| Employee time released | Exclude from cash unless payroll changes | Time study, workflow events, payroll | Net reusable capacity after review and rework |
| Additional output from released capacity | Include only attributable cash contribution when approved | Demand, accepted output, unit contribution, counterfactual | Capacity utilization and service outcomes |
The same discipline applies to quality, speed, and risk. Monetize one evidenced causal endpoint, not every intermediate step. If fewer errors reduce rework labor and also reduce incident payments, those may be separate effects; if an avoided incident estimate already includes remediation labor, adding that labor again duplicates value.
Stress-test the inputs that move the payback date
The base payback is not a promise. It is the consequence of transition cost, ramp timing, benefit realization, recurring cost, and the discount convention. Change one assumption at a time to identify sensitivity, then combine causally related variables into coherent scenarios. The 36-month NPV below uses the same 10% effective annual rate.
| Scenario | Changed input | Simple payback | Discounted payback | 36-month NPV |
|---|---|---|---|---|
| Base | As modeled | 13.28 months | 13.88 months | $832,311 |
| Lower net realization | Every positive net flow from month four is 20% lower | 15.16 months | 15.99 months | $597,117 |
| Transition overrun | Additional $60,000 outflow in month three | 14.59 months | 15.32 months | $773,724 |
| Adoption delay | The positive ramp starts three months later | 16.28 months | 17.09 months | $702,572 |
| Higher approved rate | 15% effective annual discount rate | 13.28 months | 14.19 months | $746,513 |
The simple payback does not change when only the discount rate changes; discounted payback and NPV do. The adoption-delay case has the latest discounted payback among these tests because positive flows move later. The 20% realization case produces the lowest NPV because it reduces positive flow throughout the remaining horizon. These are different decision signals.
Do not add every downside mechanically. A delayed rollout can also delay subscriptions, reduce early consumption, or change staffing. Build each combined scenario as a complete cash-flow schedule so linked effects move together and the same consequence is not counted twice.
Turn an approved payback hurdle into measurable thresholds
Suppose the organization requires payback by the end of month 18. The base model has $217,000 of cumulative undiscounted surplus and $166,209 of cumulative discounted surplus at that date. Those amounts are headroom, not guaranteed contingency. Translate them into thresholds for investment, recurring net inflow, or adoption timing.
| Month-18 threshold | Simple basis | Discounted basis at 10% | How to use it |
|---|---|---|---|
| Maximum additional month-zero investment | $217,000 | $166,209 | Stage-gate or contingency escalation trigger |
| Minimum stable monthly net inflow from month nine | $24,300 | $27,503 | Operating KPI and benefit-realization threshold |
| Maximum positive-flow delay with the same shape | About 4.7 months beyond base crossing | About 4.1 months beyond base crossing | Schedule warning; recalculate the full schedule |
The minimum stable inflow is not $345,000 divided by 18. The project has uneven transition and ramp flows, so the threshold preserves those actual periods and solves only for the stable month-nine-through-month-18 inflow. On the discounted basis, the required nominal monthly inflow is higher because later amounts have lower present value.
Assign each threshold to an owner and a source. Procurement monitors committed investment, product operations monitors eligible usage and acceptance, finance verifies realized cash effects, and the decision owner controls scope. A switching value without monitoring is merely a sensitivity result; with ownership, it becomes a control.
Do not let a short payback hide weak full-horizon value
Payback stops counting when cumulative flow reaches zero. It assigns no value to later cash flow and does not show how long benefits last. Two options can have the same payback but radically different NPV, or a shorter-payback option can create less total value than a later-payback option.
| Illustrative option, $000 | Y0 | Y1 | Y2 | Y3 | Y4 | Y5 | Simple payback | NPV at 10% |
|---|---|---|---|---|---|---|---|---|
| Option A: early, short-lived flow | −300 | 120 | 120 | 120 | 0 | 0 | 2.50 years | −$1.6k |
| Option B: slower, durable flow | −300 | 60 | 60 | 90 | 180 | 180 | 3.50 years | $106.5k |
Option A pays back one year sooner yet has slightly negative NPV at 10%; Option B pays back later but creates about $106,500 of NPV. Choosing A solely because of payback would sacrifice full-horizon value. The right decision depends on liquidity, risk, constraints, and value—not one metric.
NIST's Life Cycle Costing Manual for the Federal Energy Management Program explains that simple and discounted payback ignore costs, savings, and residual value after payback and should not be used to select among mutually exclusive alternatives. Use payback as a screen or exposure measure, then complete the full-horizon analysis.
Define a good payback period from the decision context
There is no universal “good” payback period. A 12-month hurdle can be too strict for durable infrastructure and too loose for an experimental tool with a six-month contract, unstable demand, or high switching risk. Set the hurdle before reviewing the favored project's result to reduce outcome-driven bias.
| Decision factor | Question | How it affects the hurdle |
|---|---|---|
| Useful life | How long can the service reliably produce benefits? | Payback should occur with enough life remaining to create value |
| Contract and lock-in | When can commitments change and what does exit cost? | Long or inflexible commitments increase exposure |
| Liquidity and capital scarcity | How much unrecovered capital can the organization tolerate? | Tighter liquidity may justify a shorter screen |
| Benefit uncertainty | Are adoption, cash realization, and quality evidenced? | Weak evidence requires scenarios, gates, or staged investment |
| Strategic and noncash outcomes | Does the project deliver required capability not captured in cash? | Payback cannot be the sole approval rule |
| Alternative opportunities | What other projects compete for the same capital and people? | Compare value and constraints, not payback ranking alone |
A hurdle is a governance rule, not evidence that every project just inside it is attractive or every project outside it is poor. Record who approved the hurdle, which method it applies to, the measurement horizon, and how exceptions are evaluated.
Report “no payback within the horizon” when the curve never crosses
If cumulative net cash flow remains negative through the approved horizon, the payback period is not a negative number and should not be manufactured by dividing investment by an average negative or speculative future inflow. Report the ending unrecovered balance and state that no payback occurs within the horizon.
Recommended statement: “Cumulative discounted cash flow remains negative $84,000 at month 36; therefore the project does not achieve discounted payback within the approved 36-month horizon. No value beyond month 36 is assumed.”
If a longer useful life is credible, extend the whole model—benefits, costs, maintenance, risk, refresh, and exit—not only the positive cash flow. The horizon should be chosen from service life and decision need, not lengthened until the project happens to pass.
Replace forecast payback with realized cash evidence after launch
At approval, payback is forecast. After launch, maintain two curves: the approved baseline and the latest actual-plus-forecast. Do not rewrite the baseline to make performance appear on plan. Reconcile actual invoices, commitments, payroll effects, usage, accepted output, and realized cash benefits each month.
| Variance | Definition | Example action |
|---|---|---|
| Investment variance | Actual or committed transition outflow minus baseline | Reforecast and apply the approved cost gate |
| Schedule variance | Actual benefit-start or ramp milestone minus planned date | Shift linked costs and benefits together |
| Volume variance | Eligible accepted workload minus forecast | Re-estimate gross benefit and consumption cost |
| Unit-effect variance | Actual cash effect per accepted unit minus forecast | Investigate price, labor, quality, and attribution |
| Recurring-cost variance | Actual license, usage, review, support, and control cost minus plan | Optimize workload or revise the service model |
Report forecast payback, current forecast-to-payback, and realized payback as different fields. Realized payback is observed only when cumulative verified cash flow crosses zero. If the model includes valued capacity or economic benefit, label that recovery measure separately so it cannot be mistaken for cash payback.
Use the ROI Calculator to estimate gross labor potential—not payback
The InfiniSynapse Data Analysis ROI Calculator estimates hours saved, gross annual labor-cost savings, and extra query capacity from team size, query volume, time per query, hourly cost, and an efficiency assumption. It does not include the InfiniSynapse license or a complete project cash-flow schedule. Treat its output as one directional gross-benefit input, not as net savings, ROI, or a payback date.
| Tool output or input | Payback model treatment | Required adjustment |
|---|---|---|
| Team size and hourly cost | Evidence for labor-capacity value | Use fully loaded rates and verify which roles change |
| Queries and minutes per query | Workload and baseline-time assumptions | Use eligible accepted queries, not all requests |
| Efficiency gain | Scenario input for gross time reduction | Replace the default with pilot evidence; subtract review, correction, and exception time |
| Annual cost savings | Potential gross labor value | Convert to cash only when spending changes; time-phase adoption |
| Extra query capacity | Operational outcome, not automatic cash inflow | Verify demand, acceptance, utilization, and attributable contribution |
Estimate a gross benefit input for your payback schedule
Use your own team and workload evidence, then transfer the directional result into a complete monthly cash-flow model that includes adoption, review, recurring technology cost, implementation, and the actual cash-realization route.
Open the Data Analysis ROI Calculator Directional planning tool. Its visible methodology states that license cost is not included. Use sanitized inputs and validate results with finance and operations.Build a review-ready payback analysis in twelve steps
- State the decision and baseline. Name the proposed option, business-as-usual alternative, owner, approval date, and what changes because of the investment.
- Choose the cash-flow perspective. Use project, budget, investor, or broader economic flow consistently; keep noncash outcomes separate.
- Set the horizon and period. Choose months, quarters, or exact dates based on cash-flow timing, useful life, and decision precision.
- Define the price and rate convention. Record currency, real or nominal cash flow, effective or nominal rate, compounding, taxes, and financing treatment.
- Map every transition outflow. Place acquisition, integration, migration, internal labor, training, controls, disruption, and parallel operation when they occur.
- Build the benefit mechanism. Connect eligible demand, adoption, acceptance, unit effect, utilization, and cash realization without double counting.
- Include recurring cost. Subtract licenses, usage, cloud, data, review, support, governance, maintenance, and retraining in each relevant period.
- Calculate net and cumulative flow. Use benefit minus cost for each period, accumulate in chronological order, and locate the first nonnegative balance.
- Calculate discounted payback. Discount each period consistently, accumulate present values, and locate the discounted crossing independently.
- Control interpolation. Use a fractional period only when flow accrues sufficiently evenly; otherwise report the discrete payment date or a range.
- Test scenarios and switching values. Vary adoption, realization, transition cost, recurring cost, timing, and rate; calculate the threshold that violates the approved hurdle.
- Report payback beside full-horizon value. Show NPV, ROI or net benefit, TCO, noncash outcomes, risk, evidence quality, and realized-versus-forecast controls.
Use a spreadsheet layout that exposes every assumption
Keep inputs, calculations, results, and sources separate. One row per period makes timing visible and allows reconciliation to invoices, budgets, and operational drivers. Do not hard-code totals into result cells or hide gross benefit and recurring cost inside one manual net number.
| Column | Field | Example formula or rule |
|---|---|---|
| A | Period | 0, 1, 2… in chronological order |
| B | Cash-flow date | Evidence date or the disclosed period-end convention |
| C | Incremental cash benefit | Volume × accepted rate × cash effect per accepted unit |
| D | Incremental cash cost | Transition + recurring + change + expected event cost in the period |
| E | Net cash flow | =C2-D2 |
| F | Discount factor | =1/(1+$M$1)^(A2/12) for months and an effective annual rate |
| G | Discounted net flow | =E2*F2 |
| H | Cumulative simple flow | =SUM($E$2:E2) |
| I | Cumulative discounted flow | =SUM($G$2:G2) |
| J–M | Source, owner, confidence, note | Trace each material input to evidence and approval |
Find the first row where column H is nonnegative for simple payback and the first row where column I is nonnegative for discounted payback. Use the prior row's unrecovered balance and the crossing row's flow only when interpolation is justified. Add checks that cumulative totals equal independent benefit-minus-cost totals and that dates are ordered.
Avoid ten payback-period errors that change the answer
Investment divided by annual average ignores implementation, ramp, and changing recurring cost. Accumulate actual periods.
Later integration, migration, training, control, and disruption are still investment cash flow.
Subtract subscription, consumption, review, support, maintenance, and other recurring incremental cost before accumulating.
Cash payback requires a verified cash route. Report unmonetized capacity separately.
Time-phase eligible use, acceptance, exceptions, and realized benefits from pilot evidence.
A month-end rebate does not repay capital gradually. Use its actual date.
Do not divide an effective annual rate by 12 or combine real cash flow with a nominal rate without reconciliation.
If cumulative flow never crosses zero, report no payback within the horizon and the unrecovered balance.
Payback ignores all later value. Compare NPV, TCO, outcomes, risk, and constraints.
Preserve approved forecast and show actual-plus-forecast separately so variance remains visible.
Frequently asked questions about payback period
What is the payback period?
The payback period is the earliest time when cumulative net cash flow from an investment becomes zero or positive, meaning the included investment has been recovered.
How do you calculate the payback period?
List net cash flow by period, accumulate it from the initial investment, find the first period when the cumulative balance becomes nonnegative, and interpolate only when the crossing-period flow is reasonably uniform.
What is the difference between simple and discounted payback?
Simple payback accumulates undiscounted cash flow. Discounted payback converts each future cash flow to present value before accumulation, so it is normally later when the discount rate is positive.
How do you calculate payback with uneven cash flows?
Do not divide investment by an average return. Accumulate each actual period's net cash flow in sequence and use the unrecovered balance divided by the crossing-period flow only for justified interpolation.
What is a good payback period?
There is no universal good payback period. Compare the result with the organization's approved hurdle, asset life, contract commitment, risk, liquidity constraints, and the project's value after payback.
Can an investment fail to reach payback?
Yes. If cumulative net cash flow never becomes nonnegative within the defined horizon, report no payback within the horizon rather than extrapolating an unsupported date.
Primary references for payback, discounting, and dated cash flow
- NIST Handbook 135: Life Cycle Costing Manual for the Federal Energy Management Program — general simple and discounted payback formulas, interpolation caution, and limits of payback for alternative selection.
- HM Treasury Green Book 2026 — full-lifetime appraisal, discounting, real versus nominal consistency, risk, sensitivity, and balanced value-for-money decisions.
- Microsoft Support: XNPV function — present value for cash flows that are not necessarily periodic and use corresponding payment dates.
This page is an educational planning example, not financial, accounting, tax, investment, procurement, or legal advice. The figures and rates are hypothetical. Use current contracts, verified cash evidence, applicable rules, approved organizational methods, and qualified finance reviewers for a real decision.