What is employee productivity?
Employee productivity is the amount of accepted, useful output produced from a defined amount of labor input. For an interdependent data team, measure it primarily at team or workflow level: normalize output for task complexity, adjust for quality, divide by labor hours, and use cycle time, business use, sustainability, and risk as guardrails.
The basic productivity idea is output divided by input. The OECD also cautions that labor productivity reflects more than personal effort: capital, tools, organization, technology, workflow design, and scale all affect the ratio. That distinction matters inside a company. If a data analyst is blocked by access approvals or unstable data, activity tracking cannot diagnose the system constraint.
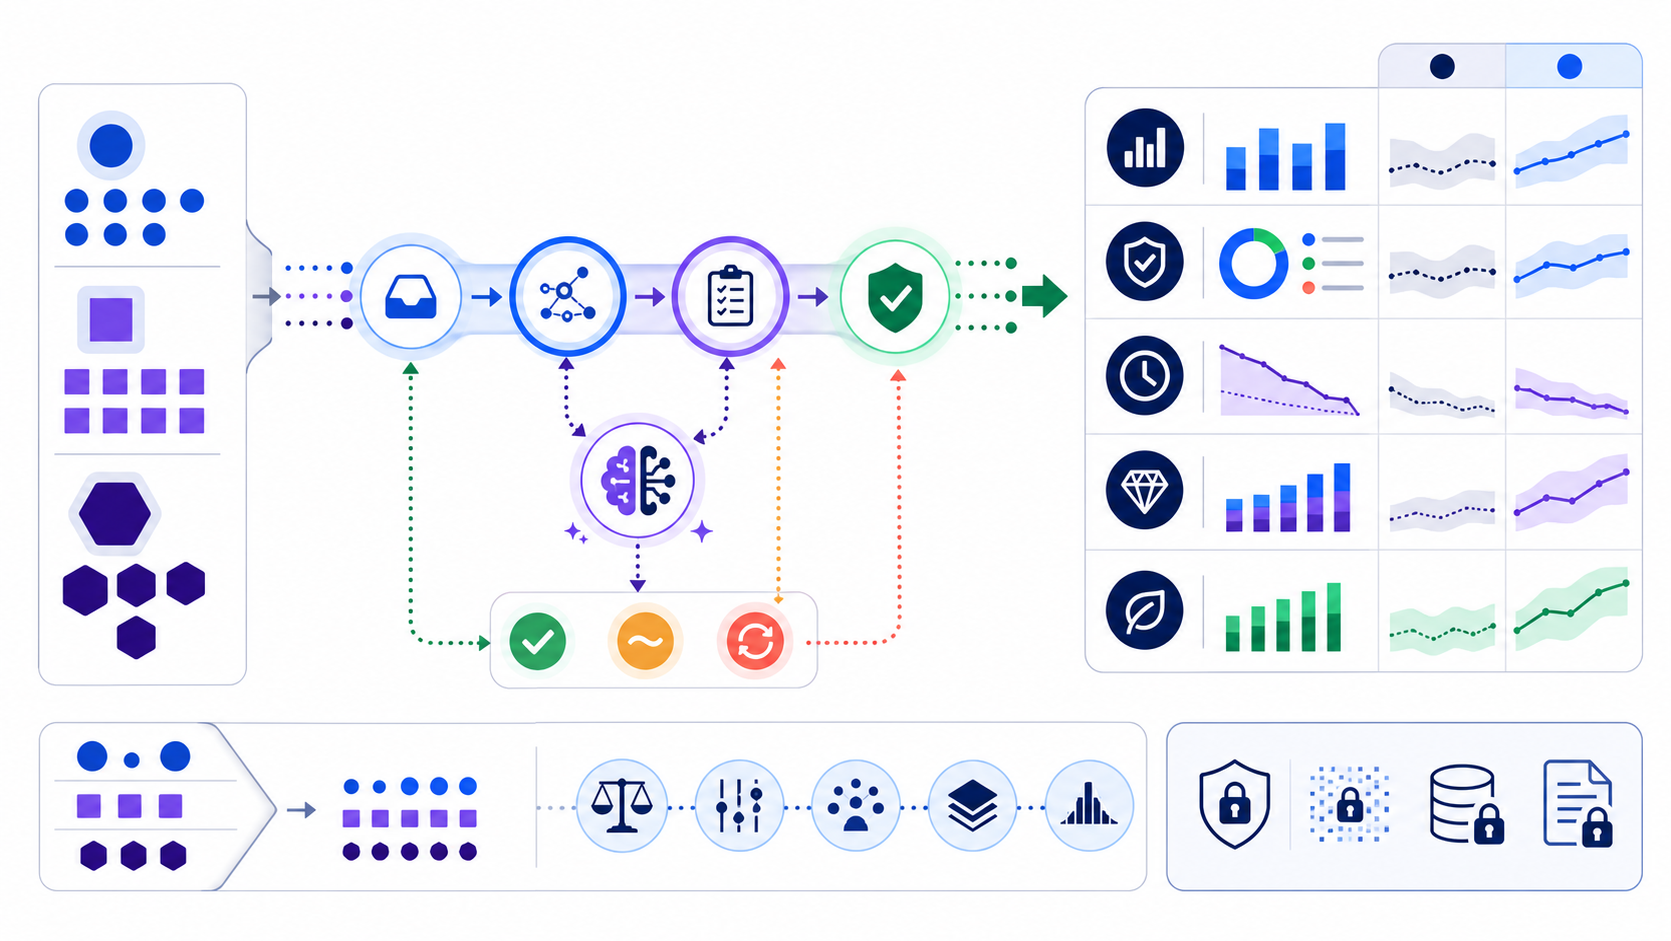
A strong measurement system therefore answers four questions together: Did the team create more accepted value? Was the work faster without shifting labor elsewhere? Did quality and risk remain within tolerance? Can the observed change be attributed to the intervention rather than easier demand or a different case mix?
Separate productivity from activity and utilization
| Concept | What it answers | Why it can mislead |
|---|---|---|
| Activity | How much visible action occurred? | Messages, queries, clicks, and meetings do not prove useful output. |
| Utilization | How much available time was assigned? | Near-full utilization increases queues and leaves no capacity for incidents or learning. |
| Efficiency | How economically was a specific task performed? | A faster low-value task can be efficient but not valuable. |
| Performance | Were agreed goals and behaviors met? | Performance includes dimensions that should not be collapsed into one ratio. |
| Productivity | How much useful, accepted output resulted from defined input? | It still needs quality, value, sustainability, and risk guardrails. |
Do not use keyboard time, online presence, prompt count, SQL lines, or dashboard count as a productivity score. These measures reward visibility and volume, create incentives to fragment work, and punish people whose work requires deep investigation, mentoring, risk review, or cross-team coordination.
Define an accepted output unit before collecting data
A productivity ratio is only as credible as its numerator. For a data team, “one output” might be a validated analysis, an approved metric definition, a resolved data-quality incident, a production-ready query, or an adopted decision product. A generated draft is not accepted output if another person must reconstruct the logic or correct the result.
One accepted analysis answers the documented decision question, uses approved sources, passes reproducibility and peer review, communicates limitations, is delivered to the named owner, and is not reopened for a material correction within seven days.
Apply one rule consistently across the baseline and comparison period. Record rejected, reopened, and partially accepted work separately. This prevents a team from appearing more productive simply because its acceptance threshold became weaker.
Use a balanced employee productivity scorecard
Use one primary productivity ratio and a small set of guardrails. Do not average every measure into an opaque score. A red quality or risk signal should remain visible even when throughput improves.
| Dimension | Recommended measures | Decision use |
|---|---|---|
| Accepted output | Quality-adjusted complexity points per labor hour | Primary productivity trend |
| Quality | First-pass acceptance, rework hours, defect severity, reproducibility | Prevent speed from hiding correction labor |
| Flow | Median and 85th-percentile cycle time, queue age, blocked time | Locate bottlenecks and unreliable delivery |
| Business value | Adoption, decision use, avoided delay, incremental action | Confirm that output is used, not merely shipped |
| Sustainability | Overtime, unplanned work, concentration risk, learning capacity | Avoid short-term gains that damage future capacity |
| AI and risk | Eligible-task adoption, human review, incidents, override and escalation | Govern AI-assisted work throughout its lifecycle |
Normalize task complexity so easier work does not win
Raw task counts are unsafe when work varies. A five-minute filter update and a multi-source causal analysis cannot each count as one unit. Create a small case-mix taxonomy before the baseline, using observable criteria rather than manager intuition.
| Class | Illustrative criteria | Example weight |
|---|---|---|
| Simple | Known source, one owner, reusable logic, low consequence | 1 |
| Standard | Multiple joins or definitions, peer review, moderate ambiguity | 2 |
| Complex | New method or source, material uncertainty, high-impact decision | 5 |
The weights are local planning units, not universal truth. Calibrate them from historical labor distributions, review them quarterly, and version every change. If complexity classification changes after the intervention, re-score the baseline or keep the periods separate.
Calculate quality-adjusted employee productivity
A practical team formula weights accepted work for complexity and quality, then divides by the labor hours required across all contributing roles. Keep quality visible as a separate guardrail even when it also adjusts the numerator.
Complexity points =
  (simple accepted × 1)
  + (standard accepted × 2)
  + (complex accepted × 5)

Quality-adjusted points =
  complexity points × first-pass acceptance rate

Employee productivity =
  quality-adjusted points ÷ total labor hours

Productivity change =
  (comparison rate ÷ baseline rate) − 1
Use total labor hours for intake, preparation, execution, validation, correction, documentation, and delivery. If AI moves review to senior staff, include those hours. If demand exceeds capacity, report throughput and queue age together; a lower queue can represent as much value as a higher output count.
Work through a quality-adjusted data-team example
Consider a hypothetical 12-person data team. In the baseline quarter it records 4,600 complexity points, an 88% first-pass acceptance rate, and 5,280 total labor hours. In the comparison quarter, after workflow redesign and controlled AI assistance, it records 5,150 points, 92% first-pass acceptance, and 5,200 labor hours.
| Calculation | Baseline | Comparison |
|---|---|---|
| Complexity points | 4,600 | 5,150 |
| First-pass acceptance | 88% | 92% |
| Quality-adjusted points | 4,048 | 4,738 |
| Labor hours | 5,280 | 5,200 |
| Adjusted points per hour | 0.767 | 0.911 |
| Observed change | — | +18.8% |
The arithmetic shows an 18.8% observed improvement, not an 18.8% causal AI effect. Before claiming attribution, check whether the complexity rubric was stable, whether work was carried over between quarters, whether staffing and holidays changed, whether demand selection changed, and whether downstream consumers actually used the additional output.
Label the number “observed productivity change” until a comparison design supports causality. Report first-pass acceptance and incidents beside it. A gain that depends on hidden rework or reduced controls is not a productive gain.
Build a baseline that survives scrutiny
- Write the decision.State whether the evidence will support workflow redesign, AI expansion, staffing, service levels, or investment.
- Freeze scope and acceptance.Name the team, workflow, task families, start and end events, exclusions, and acceptance rule.
- Choose a representative window.Cover ordinary demand plus known peaks; document releases, incidents, holidays, and staffing changes.
- Capture end-to-end labor.Include request clarification, data access, execution, review, correction, documentation, and delivery across roles.
- Audit missingness.Compare logged and unlogged work, and do not silently drop long or failed tasks.
- Version the metric.Store definitions, queries, owners, refresh dates, and change notes with the result.
Use medians and percentile distributions for time, not only averages. Show volume and sample size for every segment. A median can improve while the slowest requests become worse, so the 85th or 90th percentile is a useful reliability signal.
Measure AI assistance without assuming automation
Separate eligibility, adoption, assistance, acceptance, and realized use. If 60% of tasks are eligible and 75% of eligible tasks use the assistant, only 45% of all tasks are exposed. The value model must not apply assisted performance to the remaining 55%.
Exposed task share =
  eligible task share × adoption among eligible tasks

Accepted assisted output =
  assisted tasks × first-pass acceptance rate

Net labor change =
  baseline labor − assisted labor − review labor − rework labor

Realized capacity =
net hours recovered × approved reuse rate| Evidence layer | Required question | Typical source |
|---|---|---|
| Eligibility | Which tasks are appropriate and permitted? | Workflow inventory and risk rules |
| Adoption | Which eligible tasks actually used AI? | Task-linked usage telemetry |
| Labor | Where did execution, review, and correction time move? | Time study and workflow events |
| Quality | Was assisted output accepted at equal or stronger standards? | Blind review, defects, reopened work |
| Outcome | Was recovered capacity used for an approved purpose? | Delivery, adoption, finance, and service records |
NIST’s AI Risk Management Framework organizes risk work around govern, map, measure, and manage. For productivity programs, this means governance is not a final compliance check: risk owners, intended use, evaluation criteria, incident escalation, and monitoring should be designed before the pilot.
Use a comparison design before claiming causality
A before-and-after chart is vulnerable to seasonality, easier demand, staffing changes, learning, policy changes, and regression to the mean. Choose the strongest feasible design and state its remaining limitations.
Where safe, assign comparable eligible tasks to assisted and current workflows. Pre-register acceptance and exclusion rules.
Match tasks by family, complexity, owner experience, and time period when randomization is impractical.
Compare early and later groups over the same calendar periods, checking for spillover and shared learning.
Use repeated observations before and after launch, model prior trend, and mark concurrent operational changes.
Report effect ranges and confidence or uncertainty appropriate to the design. If the sample is small, emphasize raw counts, distributions, and operational learning instead of a precise percentage. Stop or narrow the rollout when severe quality, privacy, security, or safety signals appear.
Measure the system without turning work into surveillance
Prefer aggregated team and workflow data. Collect only information needed for a documented decision, keep it for a defined period, restrict access, explain the method to affected workers, and provide a route to challenge errors. The UK Information Commissioner’s Office advises that worker monitoring must be lawful and fair, with transparency and proportionality considered.
- Do not collect message content, screenshots, keystrokes, or continuous presence data for a productivity proxy.
- Separate operational improvement from individual performance management and state the approved uses.
- Use minimum aggregation thresholds and suppress slices that could identify a person.
- Test whether the metric disadvantages roles, locations, accessibility needs, part-time patterns, or complex assignments.
- Require human review for material decisions and document appeal, correction, and deletion processes.
This guide is a measurement framework, not legal advice. Confirm applicable employment, privacy, labor, and automated-decision requirements with qualified owners in each jurisdiction.
Improve constraints before asking people to work faster
| Observed signal | Likely system question | Testable intervention |
|---|---|---|
| Long queue age, stable execution time | Is intake exceeding capacity or priority unclear? | Triage rules, service classes, work-in-progress limits |
| High blocked time | Are data access, definitions, or ownership slow? | Pre-approved access, data contracts, named owners |
| Fast drafts, high rework | Are acceptance rules or review feedback late? | Examples, automated checks, earlier review gates |
| Low AI adoption among eligible tasks | Is the tool hard to access, trust, or fit into work? | Workflow integration, training, transparent limitations |
| Higher output, low business use | Is the team producing the wrong work? | Decision-linked intake and outcome owner sign-off |
| Output depends on one expert | Is knowledge concentrated? | Reusable assets, pairing, rotation, tested documentation |
Run one intervention at a time where possible. Define the mechanism, expected metric movement, guardrails, owner, and stop condition. A productivity program should create learning about the system, not a permanent race to maximize one number.
Build a dashboard that exposes evidence and limits
Every chart should show its definition, owner, refresh time, coverage, and known limitation. Default to weekly or monthly team trends rather than real-time individual rankings. Allow users to move from the summary to task-family distributions without exposing personal details.
| Dashboard field | Required context |
|---|---|
| Quality-adjusted points per hour | Complexity version, acceptance rule, labor scope, sample size |
| Cycle-time distribution | Start and end events, median, tail percentile, excluded cases |
| Quality and rework | First-pass acceptance, correction hours, severity, reviewer coverage |
| AI funnel | Eligible, adopted, reviewed, accepted, used; counts and rates |
| Capacity disposition | Hours recovered, hours reused, approved use, evidence owner |
| Guardrails | Incidents, overtime, unplanned work, privacy or security exceptions |
Do not hide low-volume segments behind percentages. “100% acceptance” from one task is not comparable with 91% from 500 tasks. Suppress or annotate unstable estimates, and preserve the raw numerator and denominator for audit.
Separate productivity capacity from financial value
Recovered hours are capacity, not automatically cash. Finance may recognize value when the organization avoids contractor spend, prevents planned hiring, fulfills more profitable demand, reduces a measurable delay, or reallocates time to approved work with documented value. Each route needs an owner and evidence.
| Value route | Evidence needed | Do not claim |
|---|---|---|
| Avoided cost | Approved budget, removed or reduced spend, timing | Salary × every recovered hour |
| Added throughput | Demand, accepted incremental output, unit contribution | Maximum theoretical capacity |
| Faster decision | Decision deadline, delay avoided, attributable outcome | All cycle-time reduction as revenue |
| Risk reduction | Baseline event rate, control effect, loss range, residual risk | Avoided loss without probability |
Use low, base, and high scenarios for adoption, time change, quality, capacity reuse, and implementation cost. Keep the operational evidence separate from the financial conversion so reviewers can change one assumption without rebuilding the entire analysis.
Use a nine-step employee productivity workflow
- Define the decision and owner.Write what action the evidence may change and by when.
- Map the workflow.Identify demand, actors, handoffs, controls, queues, and outcomes.
- Define accepted output.Agree on a reproducible unit and rejection rules.
- Stratify case mix.Use observable complexity criteria and versioned weights.
- Measure the baseline.Capture output, labor, quality, flow, demand, and guardrails.
- Design the intervention.State the mechanism, eligible work, controls, expected effect, and stop conditions.
- Run a credible comparison.Use randomized, matched, staggered, or time-series evidence where feasible.
- Translate capacity cautiously.Apply an approved reuse rule and document financial evidence separately.
- Monitor and revise.Compare forecast with realized use, quality, risk, and employee impact.
Avoid eight employee productivity measurement mistakes
Presence, clicks, prompts, and messages are not accepted output.
Raw counts reward easy work and distort comparisons.
Include review and correction even when another role performs it.
Use eligible-task adoption, not user accounts or licenses.
Interdependent knowledge work makes individual ratios unstable and gameable.
Recovered hours need a documented, realized use before valuation.
Show medians, tail percentiles, volumes, and distributions.
Quality, privacy, security, and sustainability remain decision constraints.
Check whether the result is ready for a decision
- The decision, owner, deadline, scope, and success or safety criteria are written.
- Accepted output and rejection rules are stable across compared periods.
- Task complexity is defined with observable, versioned criteria.
- Labor includes preparation, review, correction, and all contributing roles.
- Quality, flow, value, sustainability, and risk remain visible beside the productivity rate.
- AI eligibility, task-level adoption, human review, and rework are measured separately.
- The comparison design and remaining confounders are documented.
- Worker data has a lawful, transparent, proportionate, and access-controlled purpose.
- Capacity is separated from cash and connected to an approved realized use.
- Definitions, queries, source systems, owners, exclusions, and refresh dates are reproducible.
Turn defensible productivity evidence into an ROI model
Prepare accepted workload, baseline and comparison labor, eligible-task adoption, rework, capacity reuse, fully loaded cost, implementation cost, and low/base/high assumptions. Then model the financial case without treating every recovered hour as guaranteed savings.
Open Data Analysis ROI Calculator Use aggregated, non-sensitive inputs. Validate operational and financial assumptions with their owners.Employee productivity frequently asked questions
Define an accepted output, normalize for task complexity, divide quality-adjusted output by total labor hours, and review flow, value, sustainability, and risk as guardrails.
For a data team, use quality-adjusted complexity points divided by labor hours. Compare periods only under consistent scope, acceptance, and case-mix rules.
Usually not for interdependent knowledge work. Prefer team and workflow measures; never infer productivity from presence, keystrokes, or message volume.
Measure task eligibility, actual adoption, human review, first-pass acceptance, rework, time, and downstream use, then compare with a credible baseline or control.
Not automatically. It first creates capacity. Financial value requires evidenced avoided cost, incremental accepted output, faster value, or another approved realized use.
Include adjusted output per hour, acceptance, rework, cycle time, queue age, eligible-task adoption, outcome use, overtime, incidents, and definition notes.