What are effective cost reduction strategies?
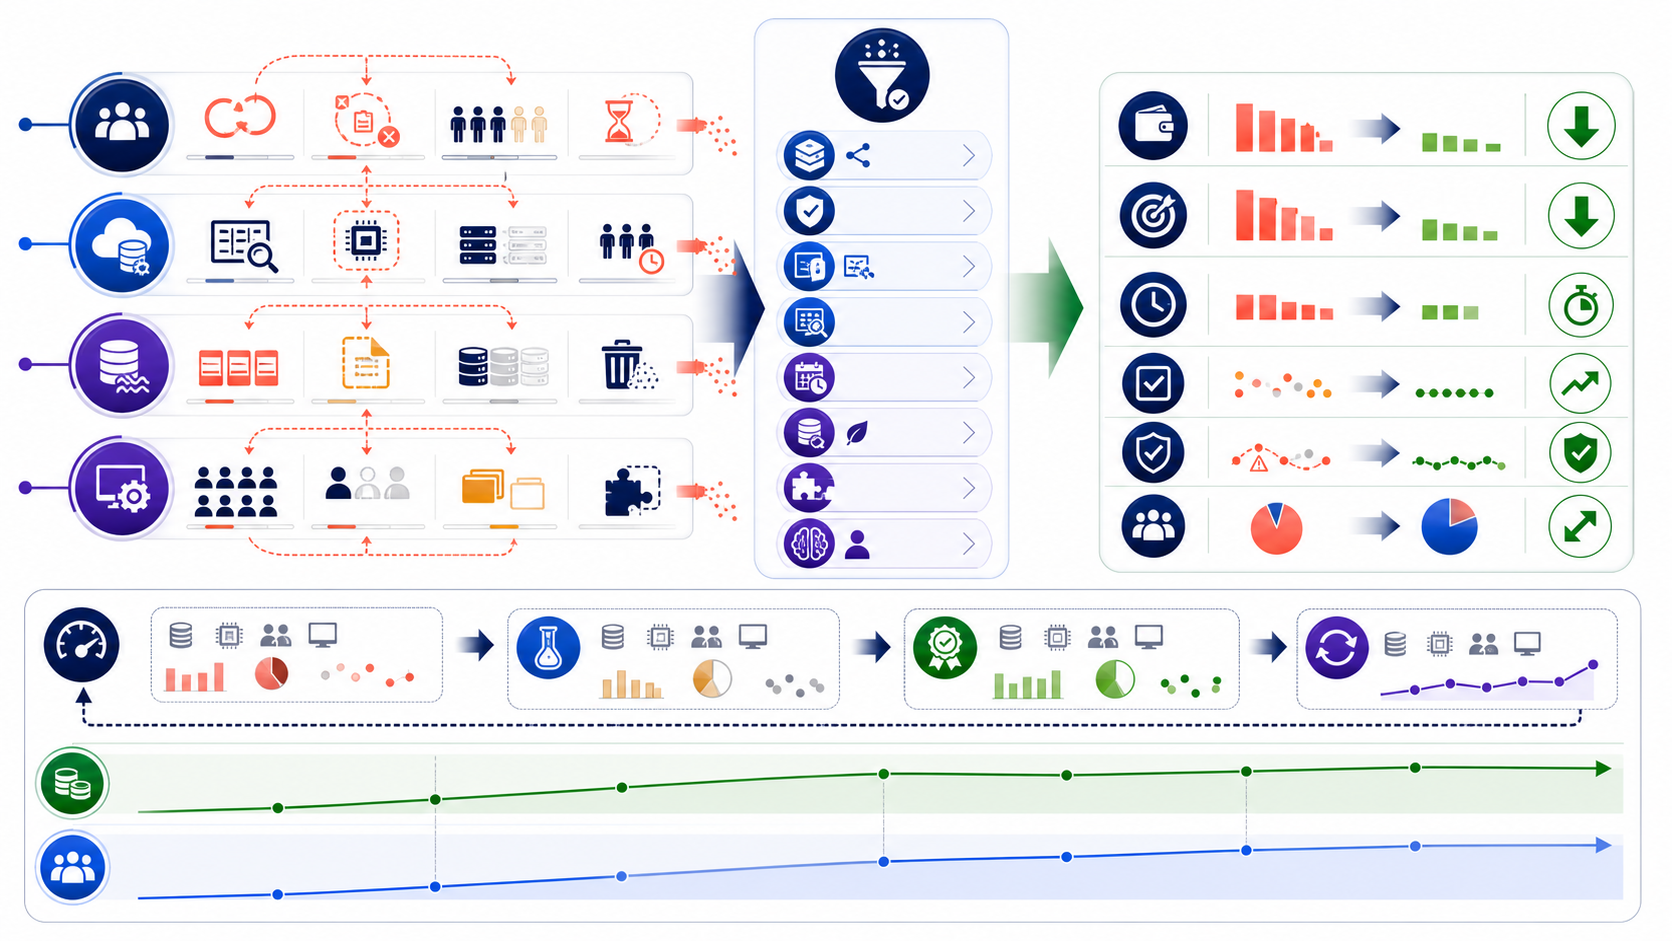
Effective cost reduction strategies remove avoidable resource use or redesign how a required outcome is delivered without weakening its acceptance standard. For a data team, start with cost per accepted output, trace labor and technology cost drivers, prioritize waste that can be removed safely, run controlled changes, and verify actual spend, capacity reuse, quality, reliability, and risk after implementation.
Cost reduction is not an across-the-board budget cut. It is a repeated operating discipline: make cost and value visible, identify the mechanism behind waste, protect non-negotiable requirements, change one controllable driver, and confirm whether the result persists. A lower bill that increases incidents, backlog, review labor, vendor lock-in, or future migration cost may be a transfer rather than a reduction.
Separate savings, avoidance, capacity, and value
| Effect | Definition | Evidence required | Example |
|---|---|---|---|
| Cash saving | Actual spend is removed or reduced. | Invoice, contract, payroll, or approved budget change | Unused licenses are terminated. |
| Cost avoidance | A credible future increase no longer occurs. | Approved forecast and attributable intervention | Demand growth is absorbed without planned contractors. |
| Capacity | Labor time becomes available for another use. | Net hours recovered and documented reuse | Analysts redirect time from repeated extraction to prioritized work. |
| Economic value | An attributable outcome improves even if spend remains. | Accepted incremental output, unit value, and causal evidence | Recovered capacity resolves more high-value requests. |
Report these categories separately. Do not multiply every recovered hour by salary and call it cash. Do not count the same workload as avoided hiring and additional output. A transparent classification lets finance reconcile spend while operations preserve useful capacity evidence.
Build a fully loaded data-team cost baseline
Set the scope before looking for reductions. Define the team or workflow, accepted output, business-as-usual demand, service levels, time horizon, and cost ownership. Include direct and indirect resources needed to deliver the outcome—not only the cloud bill.
| Cost pool | Include | Useful allocation driver |
|---|---|---|
| People | Salary, benefits, employer costs, contractors, management, review | Labor hours by task family or workflow |
| Compute and data | Query processing, pipelines, model/API usage, storage, transfer, backup | Workload tags, bytes processed, job time, storage class |
| Software and vendors | Licenses, support, overlapping features, minimum commitments | Active seats, feature use, workload, contract |
| Operations and risk | Monitoring, governance, security, incidents, rework, downtime | Incident, control, or workflow causation |
| Shared overhead | Facilities, corporate systems, finance, HR, procurement where material | Documented, consistent allocation policy |
Reconcile the baseline with finance totals and record exclusions. Use the same boundary after the change. If implementation shifts labor from analysts to platform engineers, the total workflow cost must reflect that movement.
Measure cost per accepted business output
Total spend can rise while efficiency improves because demand and value rise faster. FinOps unit economics connects technology cost with a business or technical unit, such as cost per accepted request, dashboard consumer, query, model inference, gigabyte stored, or resolved case. Choose a unit tied to the decision and preserve its acceptance rule.
Cost per accepted output =
  fully loaded workflow cost ÷ accepted outputs

Rework cost =
  correction hours × fully loaded hourly cost
  + incremental compute and vendor usage

Cloud unit cost =
  attributable compute, storage, transfer, and operations cost
  ÷ accepted business units
Segment simple, standard, and complex work when raw counts are not comparable. Show quality, cycle time, reliability, security, and demand beside cost. A cheaper unit produced by rejecting difficult requests or lowering validation standards is not an improvement.
Trace cost through a driver tree before cutting
| Driver | Diagnostic question | Evidence |
|---|---|---|
| Demand volume | Which requests support a named decision or obligation? | Intake, owner, decision, usage, repeat demand |
| Task mix | Did complexity or service class change? | Case-mix classification and volumes |
| Labor per unit | Where do waiting, handoffs, correction, and repeated discovery occur? | Workflow events, time study, reopened work |
| Technology usage | Which workload, query, dataset, user, or environment caused spend? | Billing allocation, tags, telemetry, query plans |
| Rate and contract | Does the pricing model match stable or variable demand? | Utilization, commitments, seat use, renewal terms |
| Failure cost | Which defects and incidents consume the most total effort? | Severity, probability, repair hours, downstream impact |
Rank drivers by controllable annual cost, not by visual annoyance. A frequent five-minute task may cost less than a rare incident, and a large cloud line item may be efficient if it supports proportionally more accepted value.
Use a portfolio of cost reduction strategies
| Strategy | Primary mechanism | Guardrail |
|---|---|---|
| Shape demand | Remove low-value, duplicate, or ownerless requests. | Mandatory and high-value demand remains served. |
| Standardize intake | Reduce clarification, routing, and priority effort. | Complex exceptions retain an escalation path. |
| Reuse trusted assets | Avoid repeated queries, definitions, tests, and documentation. | Ownership, freshness, and validation are visible. |
| Prevent rework | Move validation and acceptance criteria earlier. | First-pass acceptance and defects improve. |
| Optimize compute | Reduce scans, idle capacity, oversized resources, and avoidable runs. | Latency, throughput, reliability, and correctness remain within target. |
| Manage data lifecycle | Tier, archive, compact, or delete according to policy. | Retention, recovery, lineage, and legal holds are protected. |
| Consolidate tools | Remove unused seats and overlapping capability. | Migration, lock-in, support, and control costs are included. |
| Automate repeatable work | Reduce net end-to-end labor on eligible tasks. | Human review, exceptions, rework, and adoption are measured. |
Reduce cost at intake before optimizing delivery
The cheapest request to process is one that does not need to exist. Require a named consumer, decision or obligation, due date, source, acceptable accuracy, expected reuse, and consequence of delay. Route repeated questions to existing trusted products and combine similar demand into a reusable asset.
Separate incidents, regulatory work, committed decisions, standard requests, and exploration. Give each class a response target and approval rule.
Limit simultaneous work so queues, context switching, and half-finished analysis do not grow invisibly.
Retire recurring reports and pipelines with no owner, consumer, decision, or required retention.
Show requesters the cost, lead time, alternatives, and trade-offs so demand can adapt before work starts.
Track rejected and redirected demand by reason. A falling request count can be harmful if users stop asking because service is inaccessible. Pair intake savings with coverage, satisfaction, escalation, and missed-obligation checks.
Prevent quality cost instead of paying for correction
Measure the cost of poor quality across clarification, failed pipelines, incorrect definitions, rejected analysis, reopened work, incident response, and downstream correction. Do not count only the analyst who fixes the issue; include consumers, reviewers, engineers, and delayed decisions.
- Define acceptance before execution.Write the question, source, grain, metric definition, tolerance, reviewer, and delivery form.
- Move checks left.Validate schema, permissions, data freshness, test cases, and assumptions before expensive processing.
- Classify failure mechanisms.Separate source, logic, interpretation, process, tool, and review failures so actions target causes.
- Verify prevention.Track first-pass acceptance, severity, correction hours, recurrence, and escaped defects.
Turn repeated analytical work into governed reuse
Reusable SQL, semantic definitions, tested transformations, prompt patterns, validation checks, decision templates, and documented examples can reduce rediscovery and correction. Reuse is not copying unknown logic. Every asset needs an owner, purpose, approved sources, tests, version, freshness expectation, limitations, and a retirement rule.
| Reuse metric | Formula | Interpretation |
|---|---|---|
| Eligible reuse rate | Reused eligible tasks ÷ all reuse-eligible tasks | Avoids penalizing novel work. |
| Net time avoided | Baseline build time − discovery, adaptation, review, and correction time | Includes the cost of using the asset safely. |
| Reuse acceptance | Accepted reused outputs ÷ reviewed reused outputs | Prevents reuse volume from hiding stale logic. |
Reduce cloud and query cost with workload evidence
Attribute spend before optimizing. Connect billing data to account, environment, workload, owner, query, dataset, model, and business unit where feasible. Start with large, fast-growing, unowned, or low-value segments; then distinguish usage optimization from rate optimization.
| Action | Cost mechanism | Validation |
|---|---|---|
| Remove idle and orphaned resources | Stops spend with no active outcome. | Owner confirmation, dependencies, rollback, retention |
| Schedule nonproduction capacity | Aligns active time with actual use. | Developer access, start time, failed jobs, exceptions |
| Reduce data scanned | Filters, partitioning, clustering, pre-aggregation, and query reuse lower processing. | Correctness, freshness, latency, bytes processed |
| Match supply to demand | Scaling and reservation choices reduce idle or peak premiums. | Utilization distribution, queue, service objectives, forecast error |
| Control expensive or runaway jobs | Budgets, quotas, dry runs, alerts, and cancellation limit surprises. | False blocks, critical jobs, incident response |
Google Cloud notes that analytical cost depends on compute and storage pricing choices; AWS emphasizes ownership, allocation, lifecycle, demand management, and regular review. Apply the underlying principles to the actual platform rather than copying a vendor checklist without workload evidence.
Reduce storage cost without breaking data obligations
Inventory primary data, replicas, extracts, temporary tables, logs, model artifacts, backups, and recovery copies. For each class, record owner, purpose, last access, lineage, retention policy, recovery objective, legal hold, security classification, and deletion method.
- Delete confirmed temporary and orphaned assets through an approved reversible process.
- Use lower-cost tiers for infrequently accessed data when retrieval time meets requirements.
- Reduce unnecessary copies through governed sharing, not by removing required isolation.
- Compact small files and choose formats that lower storage and scan cost where supported.
- Test restore, lineage, permission, and downstream jobs before applying lifecycle policies broadly.
Reduce license and vendor cost from observed use
Create a capability and contract inventory: product, owner, purpose, active users, critical workflows, feature use, data location, integrations, renewal date, commitment, support level, migration cost, and exit requirements. “Unused login” is not the only signal; some critical tools are intentionally used rarely.
Remove inactive seats after owner review, convert occasional users to appropriate access, and automate joiner/mover/leaver controls.
Compare required capabilities, not product labels, and include migration, retraining, control, and lock-in costs.
Match commitments, variable use, support, and renewal timing to measured demand and risk.
A cheaper rate can be uneconomic when data migration, dual running, integration, and lost capability are included.
Automate only repeatable, measurable, eligible work
Prioritize tasks with stable inputs, explicit rules, sufficient volume, observable acceptance, reversible failures, and a safe exception path. Measure end-to-end net labor, not only execution time. Include preparation, supervision, review, correction, exception handling, monitoring, and maintenance.
Exposed tasks =
  total tasks × eligible share × observed adoption

Net hours recovered =
  exposed tasks ×
  (baseline labor − assisted labor − review − rework) ÷ 60

Cash saving =
  verified removed or reduced spend

Realized capacity value =
  net hours recovered × approved reuse rate × unit value
Keep cash saving and capacity value separate. If headcount, invoices, or contracts do not change, labor time is capacity. Give that capacity a financial value only when an approved use occurs and the value is not counted elsewhere.
Prioritize by controllable value, confidence, and risk
Estimate the addressable annual cost, the share the intervention can control, implementation and recurring cost, time to value, confidence, reversibility, dependencies, and guardrail risk. Do not rank opportunities by gross spend alone.
Expected annual value =
  addressable cost × controllable share × expected realization

Net first-year value =
  expected annual value − implementation cost − recurring cost

Priority considers:
  net value, confidence, time, reversibility,
  quality risk, security risk, and dependency effort
Use the score to structure discussion, not to hide judgment. A smaller reversible change with strong evidence may precede a large uncertain migration. Record why an opportunity was selected, deferred, or rejected.
Work through a data-team cost reduction example
Consider a hypothetical data team with $1.98 million in annual fully loaded cost: $1.20 million labor, $360,000 cloud and data, $180,000 software, and $240,000 contractors. It delivers 8,400 accepted requests, so the baseline cost per accepted request is $235.71.
| Intervention | Annual effect | Classification | Evidence |
|---|---|---|---|
| Query and workload optimization | $72,000 | Cash saving | Normalized invoices and workload telemetry |
| License consolidation | $36,000 | Cash saving | Executed renewal and removed seats |
| Contractor demand avoided | $60,000 | Cost avoidance | Approved baseline forecast and canceled plan |
| Reusable intake and analytical assets | 2,400 net hours | Capacity | Comparable task sample, adoption, review, rework |
The program costs $125,000 to implement and $45,000 annually to operate. Actual cash savings are $108,000, and the separately evidenced cost avoidance is $60,000. If 60% of the 2,400 recovered hours are demonstrably reused at an approved $75 per hour value, realized capacity value is $108,000. The first-year economic case is therefore $276,000 of benefit against $170,000 of cost: $106,000 net value and BCR 1.62. Financial benefit including avoidance is close to first-year break-even at negative $2,000; actual removed spend alone is negative $62,000 after first-year costs.
| Unit-cost view | Annual cost | Accepted outputs | Cost per output |
|---|---|---|---|
| Baseline | $1,980,000 | 8,400 | $235.71 |
| Steady state, same output | $1,917,000 | 8,400 | $228.21 (3.2% lower) |
| Steady state, capacity reused | $1,917,000 | 9,000 | $213.00 (9.6% lower) |
These figures are illustrative. The extra 600 outputs must meet the same acceptance and case-mix standard; otherwise the unit-cost comparison is invalid. Report cash, avoidance, capacity, and economic value separately so stakeholders can accept or change each assumption.
Verify savings with finance and operational evidence
- Freeze the baseline.Document scope, period, demand, case mix, acceptance, price basis, and exclusions.
- Record the mechanism.State exactly which resource, rate, volume, or failure changes and why.
- Measure implementation.Track adoption, coverage, exceptions, cost, and whether the planned control actually operates.
- Normalize the comparison.Adjust for price, demand, seasonality, case mix, and unrelated contract or staffing changes.
- Reconcile cash.Match invoice, contract, budget, or payroll changes with finance.
- Verify capacity reuse.Show where net hours went and which accepted outcome resulted.
- Check guardrails.Confirm quality, reliability, security, privacy, cycle time, and employee impact.
- Refresh the forecast.Replace assumptions with realized data and revise or stop actions that do not perform.
Use guardrails so lower cost does not create hidden debt
| Guardrail | Why it matters | Example stop signal |
|---|---|---|
| Accepted quality | Prevents cheaper but incorrect output. | Material drop in first-pass acceptance or severe defect |
| Reliability and recovery | Prevents removal of necessary resilience. | Service objective breach or failed restore test |
| Security and privacy | Prevents savings from weakening required controls. | Unauthorized exposure, control failure, or unapproved data use |
| Flow and access | Prevents cuts from creating queues or excluding users. | Tail cycle time or missed critical demand exceeds tolerance |
| Sustainability | Prevents cost reduction through overtime or knowledge concentration. | Overtime, attrition risk, or single-owner dependency rises |
Define thresholds and owners before the pilot. A guardrail is not a chart observed after damage; it is a decision rule that can pause, reverse, or narrow the change.
Make cost optimization a recurring operating system
| Cadence | Review | Decision owner |
|---|---|---|
| Daily or event-driven | Runaway jobs, budget alerts, failed controls, incidents | Workload and incident owner |
| Weekly | Demand, queues, rework, high-cost anomalies, action progress | Data operations lead |
| Monthly | Unit cost, cash reconciliation, capacity reuse, guardrails | Engineering, analytics, product, and finance |
| Quarterly | Architecture, contracts, tool overlap, lifecycle, targets, strategy | Investment and governance forum |
Assign every cost segment and action to a named owner. Preserve finance, engineering, security, data governance, and consumer perspectives. Cost ownership without decision rights creates reports; decision rights without evidence create arbitrary cuts.
Avoid ten cost reduction mistakes
Gross budgets do not reveal value, waste, or risk.
Labor, rework, tools, waiting, and vendor cost may dominate.
Track unit cost and accepted business value.
Easier work can create a false efficiency gain.
Time needs an approved realized use or removed spend.
One workload unit must follow one value route.
Idle-looking capacity may support recovery or peak demand.
Migration, dual running, retraining, and correction are real.
One-time cleanup decays without recurring control.
Reconcile invoices, capacity reuse, and guardrails after change.
Check an opportunity before approving implementation
- The workflow, accepted output, baseline period, demand, case mix, and service requirements are explicit.
- Fully loaded people, cloud, storage, software, operations, risk, and transition costs are in scope.
- The driver and causal mechanism are supported by attributable evidence.
- Cash saving, cost avoidance, capacity, and economic value are classified separately.
- Each workload unit follows one value route, preventing double counting.
- Implementation, recurring, migration, governance, and residual-risk costs are included.
- Quality, reliability, security, privacy, flow, and sustainability guardrails have owners and thresholds.
- The change starts with a reversible pilot where uncertainty or risk is material.
- Finance can reconcile cash effects and operations can verify capacity reuse.
- A recurring review will compare forecast, realized value, guardrails, and changing demand.
Turn verified cost reductions into an ROI case
Prepare baseline spend, accepted workload, cash savings, credible cost avoidance, net capacity, approved reuse, implementation and recurring costs, timing, adoption, rework, guardrails, and low/base/high assumptions. Then model the return without counting the same value twice.
Open Data Analysis ROI Calculator Use aggregated, non-sensitive inputs. Validate financial classification with finance and service guardrails with operational owners.Cost reduction strategies frequently asked questions
They remove avoidable resource use or redesign delivery while protecting required quality, reliability, security, and business value.
Measure cost per accepted output, shape demand, reduce rework and waiting, reuse trusted assets, optimize queries and storage, remove idle resources, consolidate licenses, and verify realized savings.
Savings reduce actual spend, avoidance prevents a credible future increase, and capacity is labor time available for another use. Report them separately.
Divide fully loaded workflow cost by outputs meeting the same acceptance standard, and segment by task family or complexity when work differs.
Attribute spend, measure unit cost and guardrails, remove idle resources, tune queries and scans, align capacity with demand, and test changes before wider rollout.
Compare verified incremental cash savings and approved realized capacity value with implementation and recurring costs, then test adoption, quality, timing, uncertainty, and double counting.