What a cost benefit analysis example must include
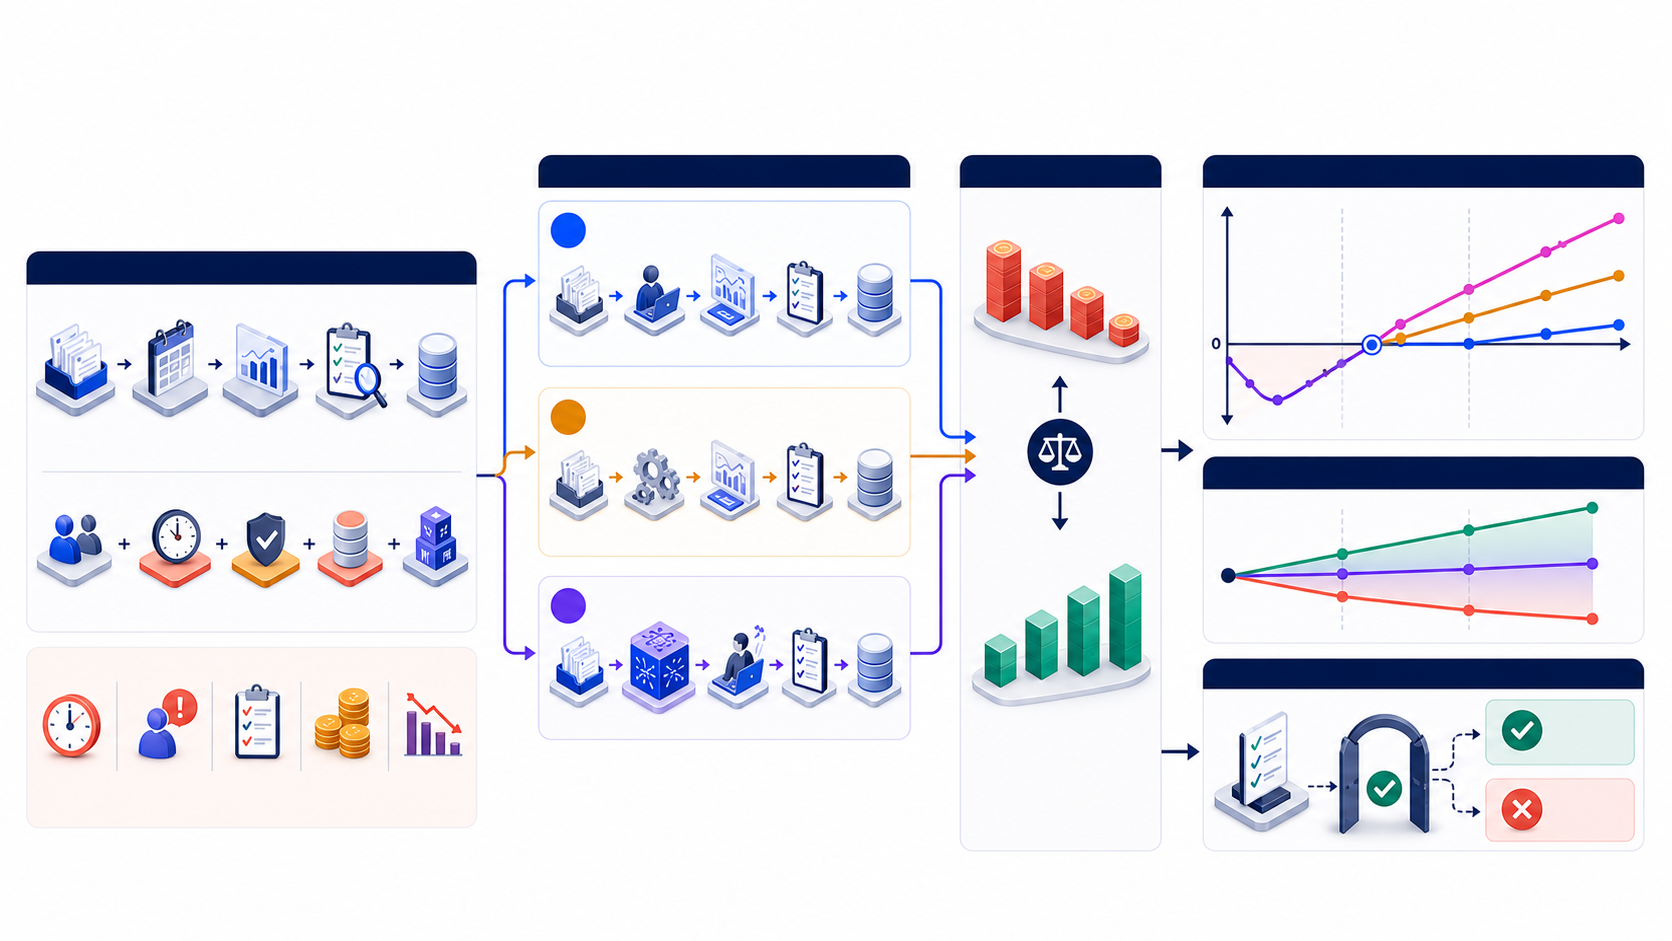
A cost benefit analysis example converts one decision into comparable options, lifecycle costs, realized benefits, timed cash flows, and at least one financial metric a reviewer can recalculate. A useful example exposes the arithmetic. A ratio with no table is a claim, not an example.
At minimum, show: the decision and the baseline; the options including business as usual; incremental costs and benefits on one horizon; net benefit; and a sensitivity or switching-value test. ROI, payback, NPV, and benefit-cost ratio are useful when they reconcile to the same cash-flow table. The cost benefit analysis formula page holds the identities; this page holds the numbers.
A simple cost benefit analysis example with numbers
Before the three-year AI walkthrough, here is a one-year case with no adoption ramp and no discounting. A team can replace a $50,000 contractor package by standardizing intake and reuse. Implementation and training cost $50,000. Avoided contractor spend in the same year is $80,000. No other benefit is claimed.
| Line | Amount | Treatment |
|---|---|---|
| Implementation and training | $50,000 | Incremental cost, year 1 |
| Avoided contractor spend | $80,000 | Cash benefit, same year |
| Net benefit | $30,000 | $80,000 − $50,000 |
| Simple ROI | 60% | $30,000 ÷ $50,000 |
| Benefit-cost ratio | 1.60 | $80,000 ÷ $50,000 |
This simple cost benefit analysis example with numbers answers “do benefits beat costs this year?” It does not answer timing, residual risk, or whether a second option is better. Keep it for teaching the arithmetic. Use the AI walkthrough below when the decision has a ramp, controls, and more than one feasible option.
Same numbers: net benefit, ROI, and benefit-cost ratio
The one-year table above uses one set of numbers three ways. Net benefit is a dollar gap. Simple ROI is that gap divided by cost. Benefit-cost ratio is benefits divided by costs. All three should tell the same story: $30,000 extra, 60% return, 1.60 times the cost.
They stop agreeing when timing and discounting enter. In the three-year walkthrough, undiscounted net benefit is $282,203 and simple ROI is 74.5%, while NPV at 8% is $217,067 and the benefit-cost ratio is 1.63. ROI is not BCR. Payback (15.7 months in that model) ignores value after the crossing date. Compare ROI-only write-ups with the ROI example; keep this page when the missing object is a broader appraisal.
Worked example: AI-assisted data workflow (3 years)
This worked example evaluates a hypothetical AI-assisted data workflow over three years. It compares the current process, a process-only improvement, and a controlled AI-assisted option using the same outcome standard. Under the stated base assumptions, the preferred option produces $661,203 in realized benefit against $379,000 in lifecycle cost, for $282,203 net benefit, 74.5% simple ROI, and payback in about 15.7 months.
The result is not an InfiniSynapse performance claim or a forecast for your organization. It is a transparent calculation model. Replace every assumption with evidence from your own workflow, keep cash savings separate from reusable capacity, and let sensitivity analysis determine whether the recommendation is robust.
Define one decision before calculating value
A data operations team receives 36,000 recurring requests per year. Analysts spend time clarifying requirements, preparing data, drafting queries, checking outputs, correcting errors, and delivering results. The decision owner must choose whether to continue the current workflow, improve intake and standardization without AI, or implement a controlled AI-assisted workflow for eligible requests.
Head of Data Operations with finance, security, and workflow-owner approval.
Three years, with implementation in year zero and a first-year adoption ramp.
Reduce active labor and cycle time without lowering the accepted quality threshold.
Approved data access, human review, audit logging, monitoring, fallback, and incident response.
The question is not “Does AI have value?” It is “Which feasible option best meets the defined outcome within the available budget and risk limits?” That wording preserves a credible counterfactual and prevents the preferred technology from becoming the premise of the analysis.
Measure the current workflow with consistent definitions
The baseline uses twelve months of request records and a representative time study. A “completed request” means an output accepted by the requester after required review; abandoned requests and rework remain visible rather than being removed. Active labor includes analyst and reviewer time, while queue time is reported separately.
| Baseline measure | Observed value | Why it matters |
|---|---|---|
| Annual recurring requests | 36,000 | Defines the addressable population, not automatic eligibility |
| Active labor per request | 22 minutes | Includes preparation, execution, review, and correction |
| Median end-to-end cycle time | 2.4 business days | Shows that queue and handoff delays also require attention |
| First-pass acceptance | 88% | Creates a common quality threshold for all options |
| Loaded labor rate | $60/hour | Used to value recoverable capacity, not payroll reduction |
Comparability rule: use the same task population, acceptance threshold, roles, observation window, and cost basis across options. If a future-state metric excludes difficult requests or reviewer time, it cannot be compared directly with this baseline.
Compare three feasible options, including business as usual
A fair analysis keeps business as usual as the benchmark and gives the non-technology option serious treatment. The process-only option improves intake forms, request classification, reusable query patterns, service levels, and review routing. The AI-assisted option includes the same process changes plus controlled drafting, retrieval, explanation, and review support for eligible tasks.
| Option | Scope | Evidence | Main limitation |
|---|---|---|---|
| A. Business as usual | Existing tools and staffing | High-confidence baseline | Backlog and labor demand continue |
| B. Process improvement | Standardization and routing | Workshop and small test | Limited effect on analysis effort |
| C. Controlled AI assistance | Process change, integration, review, monitoring | Representative pilot; adoption uncertain | Higher implementation and control cost |
Option C proceeds to detailed analysis because it meets the outcome and control requirements and has a testable delivery path. Option B remains a useful fallback and should be retained in the decision table. Option A is not “free”: future contractor spend, delay, error, and unmet demand remain part of the counterfactual, even though they are not all treated as incremental project cost.
Process-only vs AI-assisted: a smaller example
Option B in the walkthrough is the small-project counterpart: standardize intake, classification, reusable queries, and review routing with no model in the loop. The figures below are an illustrative contrast, not the same cash-flow model as Option C.
| Line | Process-only (illustrative) | Why it stays smaller |
|---|---|---|
| Year-0 cost | $28,000 | Workshop, forms, routing—no platform build |
| Annual recurring cost | $8,000 | Owner time and light maintenance |
| Steady annual benefit | $22,000 | Less analysis-minute reduction than a controlled AI path |
| Three-year net benefit | Modest positive | Lower delivery risk; weaker outcome lift |
A cost benefit analysis example for a small project should still keep business as usual on the table. If process-only meets the outcome and control limits, do not add retrieval or generation for theater. Retain Option B as the fallback in the decision table even when Option C has the higher expected value.
Record the assumptions before showing the result
The base case deliberately distinguishes total demand, technical eligibility, user adoption, gross time saved, and economically usable capacity. Multiplying total request volume directly by a demo time saving would overstate value because not every task is safe or suitable, not every user adopts the workflow, and not every recovered hour changes an organizational outcome.
| Assumption | Base value | Evidence status | Sensitivity |
|---|---|---|---|
| Annual request volume | 36,000 | Observed | Medium |
| Eligible share | 60% | Workflow sample | High |
| Adoption among eligible tasks | 75% | Pilot estimate | High |
| Human work after change | 9 minutes/request | Timed pilot including review | High |
| Loaded labor rate | $60/hour | Finance estimate | Medium |
| Recovered-capacity utilization | 65% | Management estimate | High |
| Year-one benefit ramp | 70% | Delivery estimate | High |
Include implementation, operation, control, and exit costs
The example uses incremental cost: spending and internal resources caused by Option C relative to business as usual. Year-zero implementation is $145,000. Recurring annual cost is $78,000. The estimate includes work that is often omitted from vendor-price comparisons: data preparation, integration, evaluation, security review, human-review design, training, monitoring, incident response, and retirement planning.
| Cost category | Year 0 | Annual recurring | Included work |
|---|---|---|---|
| Platform and infrastructure | $15,000 | $38,000 | License, usage, environments, logging, storage |
| Integration and data readiness | $58,000 | $8,000 | Connectors, permissions, schemas, quality remediation |
| Evaluation and controls | $27,000 | $14,000 | Test sets, review rules, security, monitoring |
| Change and training | $24,000 | $7,000 | Workflow design, enablement, support |
| Contingency, incident, and exit | $21,000 | $11,000 | Estimate risk, response capacity, portability, retirement |
| Total | $145,000 | $78,000 | Before any claimed benefit |
Internal time is not automatically free. If subject-matter experts, security reviewers, engineers, and trainers are capacity constrained, their time has an opportunity cost and may also delay other work. The cost basis should state whether amounts are cash expenditure, allocated internal labor, or economic opportunity cost so finance does not add or omit them twice.
Convert eligible use into realized, non-duplicated benefit
At steady state, 60% of 36,000 requests are eligible and 75% of those eligible requests use the new workflow. That produces 16,200 adopted requests. Human work falls from 22 to 9 minutes for those requests, recovering 3,510 hours. Only 65% of that capacity is expected to be redeployed into measured work, producing $136,890 in annual capacity value.
Recovered hours = 36,000 × 60% × 75% × (22 − 9) ÷ 60 = 3,510 hours
Capacity value = 3,510 × $60 × 65% = $136,890 per year
| Benefit type | Steady annual value | Evidence and accounting treatment |
|---|---|---|
| Redeployed analyst capacity | $136,890 | Capacity value; not a payroll saving unless budgets change |
| Avoided contractor and overtime spend | $72,000 | Cashable only when contracts or approved spend decline |
| Avoided quality and rework cost | $36,000 | Expected avoided cost from observed incident frequency |
| Total steady benefit | $244,890 | No revenue uplift is included |
Avoid double counting: do not claim the same recovered hour as labor capacity, contractor avoidance, faster delivery, and revenue. Use a benefit map that identifies the mechanism, owner, financial statement effect, and overlap with every other benefit.
Calculate net benefit, ROI, and payback step by step
Year zero contains the $145,000 implementation cost. Year one benefit is reduced to 70% of the steady-state amount to reflect staged rollout, training, and adoption: $244,890 × 70% = $171,423. Years two and three use the steady annual benefit of $244,890. Recurring cost is $78,000 each operating year.
Three-year net benefit = $661,203 total benefit − $379,000 total cost = $282,203
Simple ROI = $282,203 ÷ $379,000 × 100 = 74.5%
Payback = 12 months + $51,577 remaining ÷ ($166,890 ÷ 12) = 15.7 months
Simple ROI is a ratio over the selected horizon; it does not show timing. Payback shows when cumulative undiscounted cash flow turns positive, but ignores value after that point. Use both alongside a year-by-year cash-flow table, and use discounted measures when timing is material or the approval policy requires them.
Reconcile every result to a three-year cash-flow table
| Period | Benefit | Cost | Net cash flow | Cumulative |
|---|---|---|---|---|
| Year 0: implement | $0 | $145,000 | −$145,000 | −$145,000 |
| Year 1: ramp | $171,423 | $78,000 | $93,423 | −$51,577 |
| Year 2: steady | $244,890 | $78,000 | $166,890 | $115,313 |
| Year 3: steady | $244,890 | $78,000 | $166,890 | $282,203 |
| Total | $661,203 | $379,000 | $282,203 | $282,203 |
The cumulative balance remains negative at the end of year one, so calling the project “first-year positive” would be misleading if implementation cost is part of the investment decision. The project crosses zero about 3.7 months into year two under an even monthly realization assumption. In practice, use monthly or quarterly timing for large contracts, phased staffing, seasonal demand, or delayed benefits.
Add discounted value without hiding the assumptions
For illustration, apply an 8% annual discount rate to years one through three while leaving year-zero cost undiscounted. This produces present-value benefits of $563,080 and present-value costs of $346,014. The resulting net present value is $217,067 and the benefit-cost ratio is 1.63.
NPV at 8% = PV of benefits $563,080 − PV of costs $346,014 = $217,067
Benefit-cost ratio = $563,080 ÷ $346,014 = 1.63
Eight percent is an illustrative corporate rate, not a universal recommendation. Use the rate, timing convention, inflation basis, tax treatment, and metric definitions approved by your finance team. Public-sector social appraisal may require a prescribed social discount rate and a wider perspective than organizational cash flow.
Test the assumptions that can reverse the decision
The base case is not a prediction. It is one internally consistent combination of assumptions. The downside case reduces eligibility, adoption, time saved, and usable capacity while increasing recurring cost. The upside case uses stronger coverage and reuse but does not remove review or control. These scenarios expose the range of plausible outcomes without assigning false precision to a single estimate.
| Driver | Downside | Base | Upside |
|---|---|---|---|
| Eligible share | 50% | 60% | 70% |
| Adoption | 55% | 75% | 85% |
| Minutes saved per adopted request | 10 | 13 | 15 |
| Capacity utilization | 45% | 65% | 80% |
| Steady annual capacity value | $44,550 | $136,890 | $257,040 |
| Other annual benefit | $55,000 | $108,000 | $150,000 |
| Recurring annual cost | $86,000 | $78,000 | $72,000 |
In the downside, steady annual benefit is only $99,550 before ramp-up, leaving little margin over $86,000 recurring cost and making the initial investment difficult to recover within three years. In the upside, steady annual benefit reaches $407,040. The recommendation should therefore depend on evidence for eligibility, adoption, minutes saved, utilization, and control cost rather than on a generic productivity claim.
Calculate switching values, not only optimistic ranges
A switching value is the point at which a key assumption changes the decision. At 100% adoption, the eligible workload could generate $182,520 of capacity value and $144,000 of other benefit, or $326,520 total steady benefit. To cover $223,000 of implementation plus first-year recurring cost without a ramp adjustment, adoption must reach approximately 68.3% if benefits scale proportionally.
| Threshold question | Illustrative answer | Decision use |
|---|---|---|
| Minimum adoption without ramp | 68.3% | First-year total benefit equals $223,000 cost |
| Minimum adoption with 70% ramp | 97.6% | Shows why year-one cumulative value stays negative |
| Maximum recurring cost at steady state | $244,890 | Above this, annual operating benefit is negative |
| Maximum payback under policy | Set by organization | Turns a preference into an approval gate |
The 97.6% result is a warning, not a target: a one-year ramp makes full first-year recovery unrealistic under the base design. If policy requires twelve-month payback, the team must reduce implementation cost, accelerate adoption, increase validated benefit, change scope, or reject the project. It should not hide the mismatch by moving year-zero cost outside the calculation.
Keep financial results beside quality, risk, and evidence
A cost-benefit ratio does not prove that an option meets the objective. The decision table below shows why Option C is preferred conditionally rather than automatically. Option B has lower cost and lower delivery risk, while Option C has greater expected value but depends on representative pilot evidence and functioning controls.
| Decision factor | Business as usual | Process improvement | Controlled AI assistance |
|---|---|---|---|
| Outcome improvement | Low | Medium | High if adoption holds |
| Incremental lifecycle cost | Low | Low-to-medium | $379,000 |
| Expected value | Negative trend | Modest positive | $282,203 base net benefit |
| Evidence confidence | High | Medium | Medium; adoption and reuse uncertain |
| Control burden | Existing | Small change | Evaluation, review, monitoring, fallback |
| Recommended status | Reject as preferred option | Retain as fallback | Approve conditionally |
Price controls and keep residual risk visible
AI project economics can look attractive when evaluation, review, security, monitoring, incident response, and model-change management are excluded. This example includes those controls in cost, but the decision still needs a risk register connecting each material failure mode to an owner, preventive and detective controls, response, residual exposure, and stop condition.
| Risk | Control and metric | Decision threshold |
|---|---|---|
| Unreliable output | Representative evaluation, human review, acceptance and correction rate | No scale if quality falls below baseline |
| Unauthorized data use | Access control, data boundaries, logs, security testing | Zero unresolved severe access incidents |
| Review burden exceeds estimate | Measure review and correction time by task type | Recalculate if total work exceeds 9 minutes |
| Low adoption | Eligible-task use, abandonment, interviews, workflow telemetry | Do not scale below approved adoption gate |
| Supplier or model change | Version tests, portability, fallback, exit plan | Suspend affected workflows after failed regression test |
The NIST AI Risk Management Framework describes risk work through govern, map, measure, and manage. It is a useful voluntary reference for organizing responsibility and evidence, not a certification claim. Apply it proportionately to the decision, affected people, data, model behavior, and consequences.
Approve the next evidence gate, not an unchecked forecast
Illustrative recommendation: approve Option C for controlled production within the $145,000 implementation envelope, subject to security approval, representative evaluation, and monthly benefit tracking. Authorize wider scale only if eligible-task adoption reaches at least 70%, accepted quality does not fall below the agreed baseline, severe incidents remain zero, total human work stays at or below 9 minutes per adopted request, and the refreshed three-year ROI remains positive in the approved downside scenario.
The recommendation is conditional because the largest value drivers—adoption, eligible coverage, human review, and capacity reuse—are not fully proven before production. Each gate should name the evidence owner, measurement window, sample coverage, approval authority, response when a threshold fails, and the date when the model is refreshed.
Spreadsheet layout for the example
Reuse the same columns the three-year table uses: Period, Benefit, Cost, Net cash flow, Cumulative. Add a cover sheet for the decision, owner, horizon, discount rate, and whether amounts are cash or capacity. Put one assumption per row with source, owner, and date.
| Sheet | Columns | Rule |
|---|---|---|
| Cash flow | Period · Benefit · Cost · Net · Cumulative | Every headline metric must sum from this sheet |
| Assumptions | ID · Statement · Source · Owner · Sensitivity | No silent cell; every driver has an owner |
| Options | Option · Scope · Evidence · Limitation | Keep business as usual visible |
This page is the narrative worked case. For a reusable blank structure, use the cost benefit analysis template. Do not paste credentials or confidential project files into a shared calculator.
How to do a cost benefit analysis in nine steps
- Frame the decision. Name the owner, deadline, population, objective, budget, constraints, and available choices.
- Measure business as usual. Use consistent task, time, quality, demand, risk, and cost definitions.
- Generate feasible alternatives. Include no-change, process-only, limited pilot, and scaled variants where credible.
- Estimate lifecycle cost. Cover implementation, operation, controls, support, incidents, contingency, and exit.
- Map benefit mechanisms. Connect each benefit to eligible use, adoption, attribution, utilization, evidence, and an owner.
- Build timed cash flow. Place costs and realized benefits in the period when they actually occur.
- Calculate consistent metrics. Reconcile net benefit, ROI, payback, NPV, and BCR to one cash-flow model.
- Stress-test and find switching values. Change high-impact assumptions and calculate the threshold that reverses the recommendation.
- Write a conditional decision. State the option, funding, owner, controls, evidence gaps, gates, monitoring, and stop rules.
Mistakes that make an attractive cost benefit analysis example unusable
Total volume is not the same as eligible and adopted volume. Do not multiply a demo time saving by every request.
Recovered time becomes cash only when an approved budget or payment changes.
Evaluation, human review, monitoring, response, and exit require resources.
Do not compare three-year benefit with one-year cost.
Training, integration, workflow change, and adoption delay value realization.
Affordability, objectives, risk, evidence, and non-monetized effects still matter.
Test your assumptions in the ROI Calculator
Use the InfiniSynapse ROI Calculator to model your own investment, operating cost, realized benefit, horizon, and return. Start with the base case, then create downside and upside copies. Preserve the source, owner, date, confidence, and calculation basis for every input outside the calculator so the result remains reviewable.
Model the economics of your project
Enter evidence-based costs and benefits, compare scenarios, and use the result as one input to a documented decision.
Open ROI CalculatorDo not enter credentials, personal data, or confidential project information.Frequently asked questions
What is a cost benefit analysis example?
It shows how a defined decision becomes comparable options, lifecycle costs, realized benefits, cash flows, financial metrics, sensitivity tests, and an evidence-based recommendation. A useful example exposes assumptions and arithmetic rather than displaying only a final ratio.
How do you calculate cost-benefit analysis?
Define the baseline and alternatives, estimate incremental costs and benefits over a common horizon, place them in the period when they occur, calculate net benefit, ROI, payback, and discounted measures where appropriate, then test uncertainty and switching values.
Which costs should an AI project include?
Include implementation, licenses, infrastructure, integration, data work, security, evaluation, human review, training, change management, support, monitoring, incident response, contingency, and exit or decommissioning. State whether internal labor is cash, allocated cost, or opportunity cost.
How should time saved be valued?
Multiply only eligible and adopted work by the measured reduction in total human time, the appropriate loaded labor rate, and the share of capacity that can be redeployed. Keep this capacity value separate from cash savings unless payroll, contractors, overtime, or approved hiring actually changes.
When does a positive ROI justify approval?
Positive ROI is necessary but not sufficient. Approval also depends on strategic fit, affordability, evidence confidence, safety and legal thresholds, non-monetized effects, delivery capacity, and whether the recommendation survives plausible downside assumptions.
What is a simple cost benefit analysis example with numbers?
A one-year case is enough: $50,000 incremental cost, $80,000 avoided contractor spend, $30,000 net benefit, 60% simple ROI, and a 1.60 benefit-cost ratio. Use a multi-year discounted model when timing, ramp, or residual risk can change the decision.
How is a cost benefit analysis example different from an ROI example?
An ROI example reports a ratio. A cost benefit analysis example also keeps options, lifecycle costs, timed cash flow, and usually NPV or a benefit-cost ratio on the same table so a reviewer can reject a high percentage that hides timing or missing controls.
Sources, scope, and calculation notes
The figures in this page are a hypothetical instructional example created to demonstrate a transparent organizational cost-benefit model; they are not measured product results. The method draws on official guidance that emphasizes options, lifecycle costs and benefits, uncertainty, monitoring, risk, and documented assumptions.
HM Treasury, The Green Book (2026) — appraisal of objectives, options, lifecycle costs and benefits, risk, discounting, sensitivity, and switching values. Its public-sector social-value perspective is broader than this organizational example.
HM Treasury, Guidance on Developing Business Cases — the Five Case Model and development of decision-ready spending proposals.
NIST AI Risk Management Framework — voluntary guidance for governing, mapping, measuring, and managing AI risk.
U.S. GAO Cost Estimating and Assessment Guide — best practices for documented assumptions, credible cost estimates, sensitivity, risk, and updates with actual data.
All calculations are rounded to the nearest dollar or one decimal place. The example assumes benefits occur evenly within each operating year for the payback interpolation. An 8% illustrative rate is used only in the discounted example. Your finance, accounting, tax, procurement, legal, privacy, security, and risk teams should review the actual model before a real commitment.