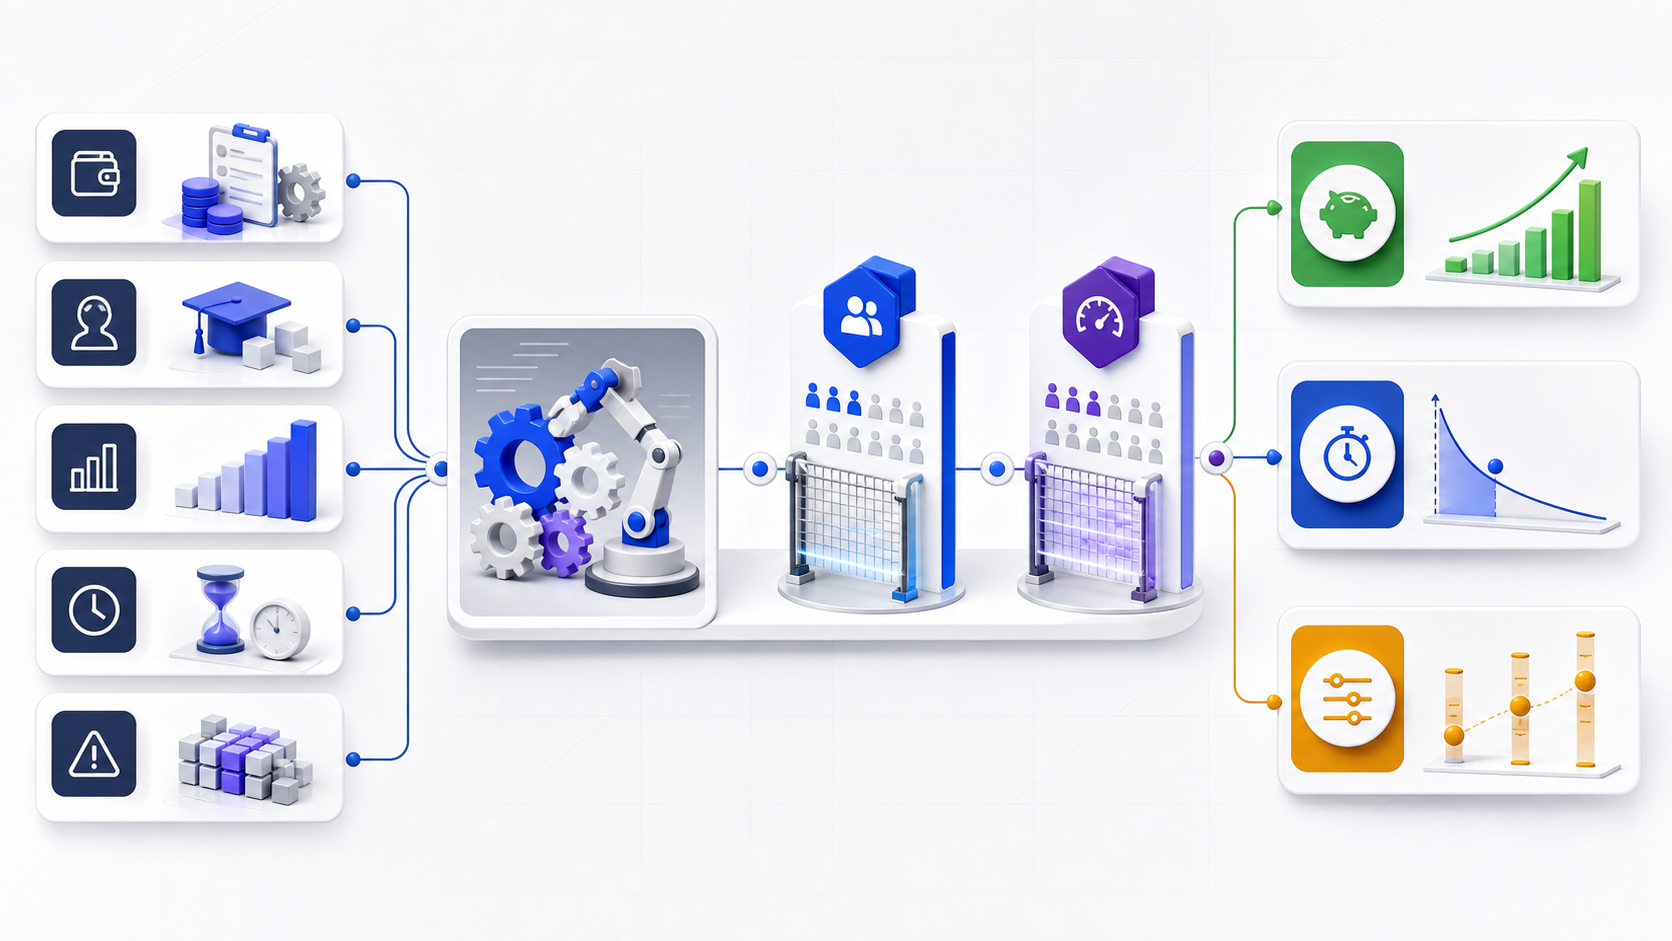
How do you calculate automation ROI?
Automation ROI equals realized automation benefits minus total automation costs, divided by total automation costs, multiplied by 100. A defensible model adjusts benefits for eligible process volume, actual adoption, exceptions, rework, and usable capacity. It includes implementation, integration, training, licenses, oversight, maintenance, and risk—not only software price.
Use ROI together with payback period, net benefit, and evidence quality. A high percentage can still be a weak decision if it depends on full adoption, ignores review labor, counts capacity as cash, or uses a measurement window shorter than the implementation cycle.
Define the automation boundary before assigning value
Start with one named workflow and one decision. “Automate data work” is too broad. A useful scope might be “generate first-draft SQL for recurring analyst requests, while retaining human validation and approval.” Document the process owner, users, inputs, outputs, supported cases, exclusions, quality rule, baseline period, and decision date.
Separate task automation from end-to-end process automation. Saving ten minutes in query drafting may not reduce cycle time when requirements, data access, validation, or stakeholder approval remain the bottleneck. Measure the complete labor path and identify which step actually changes.
Collect inputs that finance and operations can verify
| Input | What it means | Preferred evidence |
|---|---|---|
| Eligible annual volume | Tasks the automation can realistically support | Workflow logs with eligibility rules |
| Baseline labor | End-to-end minutes across all roles before automation | Time study and event timestamps |
| Automated labor | Human time still required for preparation, review, and exceptions | Representative controlled pilot |
| Adoption | Eligible tasks actually using the workflow | Usage events joined to task records |
| Rework and exception cost | Correction labor, failed runs, manual fallback, and escalation | Review outcomes and incident records |
| Loaded labor value | Salary plus relevant benefits and employer costs per hour | Finance-approved rate |
| Upfront costs | Discovery, implementation, integration, training, and governance | Project budget and internal labor plan |
| Recurring costs | Licenses, infrastructure, monitoring, support, and maintenance | Contracts and operating forecast |
Keep units visible. Store task counts, minutes, hours, currency, and percentages in separate fields. Record the source, owner, observation period, and confidence for each input. This prevents a spreadsheet from appearing more precise than its evidence.
Use an adoption-adjusted automation ROI formula
Calculate realized benefits before ROI. First estimate eligible annual volume. Then blend automated and baseline labor by observed adoption, add rework, and apply a utilization factor if recovered capacity is being valued rather than removed from a budget.
Effective automated minutes =
  automated minutes + exception minutes + rework minutes

Adoption-weighted minutes =
  (adoption × effective automated minutes)
  + ((1 − adoption) × baseline minutes)

Annual labor hours recovered =
  eligible annual volume ×
  (baseline minutes − weighted minutes) ÷ 60

Realized capacity value =
  recovered hours × loaded hourly value × utilization

Total realized benefit =
  capacity value + avoided cash costs + verified quality value

Total automation cost =
  upfront cost + recurring cost + internal oversight cost

Automation ROI (%) =
  (total realized benefit − total automation cost)
  ÷ total automation cost × 100

Payback months =
  upfront cost ÷ monthly net recurring benefit
Use the same time horizon in the numerator and denominator. If the model covers three years, include three years of recurring benefits and costs, implementation timing, ramp-up, replacement risk, and discounting where required by the organization. Do not compare a three-year benefit with a one-year cost.
Separate four automation benefit categories
Recovered hours that can be redirected to accepted work. Apply a utilization factor and avoid calling capacity cash.
Reduced overtime, contractor spend, external services, planned hiring, or another budgeted expense with evidence.
Fewer correction hours, incidents, credits, or review cycles, measured against the same acceptance standard.
Earlier decisions or shorter queues only when the business consequence and attribution are documented.
Prevent double counting. If recovered analyst hours reduce contractor spend, do not also value the same hours as additional capacity unless both outcomes can occur. If lower error rates already appear as reduced rework labor, do not add the same labor again under quality savings.
Include costs that appear after the purchase order
License price is rarely the complete denominator. Automation may require workflow discovery, process redesign, data preparation, API or database integration, security review, user testing, training, documentation, change management, model evaluation, monitoring, incident response, and periodic maintenance.
| Cost layer | Typical items | Timing |
|---|---|---|
| Discovery | Process mapping, feasibility, baseline collection | Before approval |
| Implementation | Configuration, integration, testing, migration | Upfront and staged |
| Adoption | Training, support, temporary productivity dip | Ramp-up |
| Operation | Licenses, infrastructure, human review, monitoring | Recurring |
| Control | Security, privacy, governance, audit, incident handling | Upfront and recurring |
| Exit | Contract termination, replacement, data export, rollback | Contingent |
Use internal loaded labor rates for implementation and oversight, not zero. Internal time has an opportunity cost even when no invoice is issued. Keep sunk discovery costs separate when the decision is whether to continue rather than whether to start.
Work through a realistic automation ROI example
Consider a hypothetical data team with 24,000 eligible recurring tasks per year. The measured baseline is 18 labor minutes per task. In a controlled pilot, the automated workflow requires 7 minutes of human work, plus 0.8 expected rework minutes. Adoption is 75%. The finance-approved loaded labor value is $55 per hour, but only 65% of recovered capacity has an approved use.
| Step | Calculation | Result |
|---|---|---|
| Effective automated time | 7 + 0.8 | 7.8 minutes |
| Weighted time | (75% × 7.8) + (25% × 18) | 10.35 minutes |
| Recovered hours | 24,000 × (18 − 10.35) ÷ 60 | 3,060 hours |
| Realized capacity value | 3,060 × $55 × 65% | $109,395 |
| Verified avoided cash cost | Contractor and overtime reduction | $64,000 |
| Quality value | Measured correction and incident reduction | $28,000 |
| Annual realized benefit | $109,395 + $64,000 + $28,000 | $201,395 |
Assume $110,000 of upfront implementation, training, and governance cost, plus $60,000 of annual licenses, monitoring, maintenance, and oversight. First-year total cost is $170,000. First-year net benefit is $31,395, so first-year ROI is 18.5%. Monthly net recurring benefit after steady state is approximately ($201,395 − $60,000) ÷ 12 = $11,783, giving an estimated payback of about 9.3 months on the upfront investment.
This is a hypothetical planning example. It is not an InfiniSynapse performance claim. Real results depend on workflow eligibility, baseline quality, user behavior, data access, review requirements, demand, and actual cost changes.
Model adoption at the task level, not the account level
Purchased seats and trained employees do not prove adoption. Measure the share of eligible tasks that actually use the workflow. Report eligibility coverage separately: an automation may achieve 90% adoption among supported tasks while supporting only 40% of total demand.
Track exceptions as work, not as noise. Unsupported inputs, security restrictions, ambiguous requests, low-confidence outputs, failed integrations, and approval escalations all consume labor. Add expected exception minutes to automated task time and preserve manual fallback capacity where continuity requires it.
Risk-adjust benefits instead of hiding automation failures
An automation is not valuable merely because it is fast. Pair speed with acceptance rate, defect severity, rework minutes, unresolved incidents, consumer outcomes, privacy or security findings, and audit exceptions. Set minimum quality and safety thresholds before calculating scale benefits.
For AI-enabled automation, use a structured risk process. The NIST AI Risk Management Framework organizes work around governing, mapping, measuring, and managing risk. A financial model should make the cost of evaluation, human oversight, monitoring, incident response, and remediation visible rather than treating control work as external to ROI.
Keep capacity value separate from cash savings
Recovered hours are capacity until a specific use converts them into value. The team may shorten a queue, complete additional analyses, improve documentation, reduce burnout, or avoid a future hire. Each outcome needs its own evidence and valuation rule.
A budgeted expense is actually removed, avoided, or contractually reduced.
People remain employed and the benefit is more output, shorter waits, resilience, or better quality.
If the organization has no plan or demand for recovered time, use a low utilization factor or report hours without monetizing them. This may lower the headline ROI, but it gives decision-makers a more useful picture.
Calculate payback from cash flow timing, not annual averages
Simple payback divides upfront investment by monthly net recurring benefit. That shortcut works only after the workflow reaches steady state. If implementation takes four months and adoption ramps over six more months, the real payback date is later than an annual average suggests.
Build a monthly or quarterly cash-flow schedule when timing matters. Place implementation invoices, internal project labor, subscription start dates, training, ramped benefits, maintenance, and renewal commitments in the periods when they occur. For longer investments, follow the organization's approved discount-rate and appraisal policy rather than inventing a rate.
Test the assumptions most likely to break the business case
A single ROI number hides uncertainty. Build low, base, and high cases from observed pilot ranges. Hold unrelated inputs constant so stakeholders can see which mechanism changes the result.
| Scenario | Adoption | Automated time | Capacity utilization | Decision meaning |
|---|---|---|---|---|
| Low | 50% | 10 minutes | 40% | Adoption friction and exceptions persist |
| Base | 75% | 7.8 minutes | 65% | Pilot median with funded controls |
| High | 90% | 6.5 minutes | 80% | Requires mature users and stable integration |
Calculate break-even values as well: minimum adoption, maximum recurring cost, maximum exception time, or minimum utilization that keeps the decision above its hurdle. If the model fails with a small change in one uncertain input, run another experiment before scaling.
Build an automation business case in eight steps
- Name the workflow and decision.Define owners, users, boundaries, exclusions, and the date a decision is needed.
- Freeze the acceptance standard.Measure only outputs that meet the same quality and safety rule before and after automation.
- Measure the baseline.Capture volume, labor across roles, cycle time, errors, rework, and external cost.
- Map every cost.Include discovery, implementation, adoption, operation, control, maintenance, and exit.
- Run a representative pilot.Use comparable users and tasks; record exceptions and manual fallbacks.
- Calculate realized value.Adjust for eligibility, adoption, rework, utilization, timing, and quality.
- Stress-test the result.Show low, base, high, and break-even cases with source evidence.
- Verify after rollout.Compare forecast with actual cash flow, usage, quality, incidents, and capacity reuse.
Avoid seven automation ROI mistakes
Weight benefits by measured eligible-task usage.
Include preparation, validation, correction, and escalation labor.
Separate capacity from costs actually removed from a budget.
Include implementation, integration, control, and maintenance.
Do not count the same rework labor under two benefit labels.
Place benefits in the periods when adoption actually occurs.
Show ranges, break-even points, and confidence in each input.
Check whether the automation ROI is decision-ready
- The workflow, owner, eligible volume, and exclusions are documented.
- Baseline and pilot use the same output and quality standard.
- Labor includes preparation, review, correction, and exception handling across roles.
- Adoption is measured from eligible tasks rather than seats or trained users.
- Capacity value and cash savings are shown separately.
- Upfront, recurring, internal, control, maintenance, and exit costs are visible.
- Benefits and costs use the same time horizon and realistic ramp-up.
- Low, base, high, and break-even cases use explainable input ranges.
- Every material input has a source, owner, period, unit, and confidence level.
- A post-rollout review will compare forecast and realized value.
Model your automation costs, savings, and payback
Prepare eligible annual volume, baseline and automated labor time, adoption, rework, loaded labor value, implementation cost, recurring cost, and utilization assumptions. Then use the InfiniSynapse Data Analysis ROI Calculator to compare benefit, cost, net value, payback, and scenarios.
Calculate Your Automation ROIUse aggregated, non-sensitive inputs and verify assumptions with finance, workflow, security, and data owners.Automation ROI frequently asked questions
Subtract total automation costs from realized benefits, divide by total costs, and multiply by 100. Adjust benefits for eligibility, adoption, rework, utilization, and timing.
Include discovery, implementation, integration, training, licenses, infrastructure, monitoring, human review, maintenance, security, governance, and rollout disruption.
Only when a budgeted cost is actually avoided or reduced. Otherwise report time as capacity and use a documented utilization rule if it is monetized.
Apply measured adoption to eligible task volume, then include exceptions, manual fallback, rework, and the time required to reach steady state.
There is no universal threshold. Compare payback with the organization's hurdle rate, contract term, technology life, implementation risk, and evidence confidence.